Aus Betriebsdaten Entscheidungen pro Feld machen
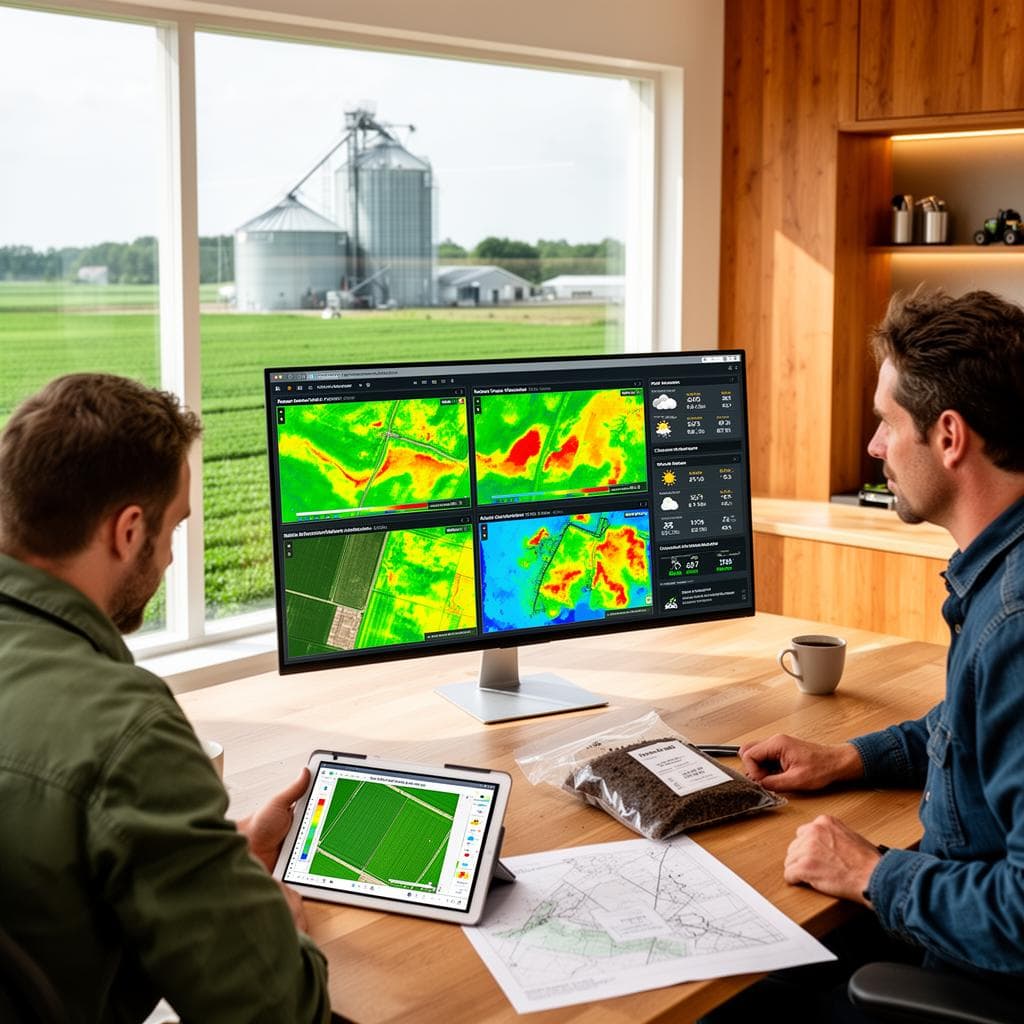
Landwirtschaftliche Betriebe ertrinken in ihren eigenen Daten: gekaufte, aber unverarbeitete Satellitenbilder, Feldgrenzen in Tabellen, Maschinendaten in den Terminals der einzelnen Hersteller gefangen, und sechs Datenquellen, die nie auf einem Bildschirm zusammenkommen.
Die Antwort ist eine räumliche Plattform vom Satelliten bis zur Maschine. Unser Produktionsteam macht aus Rohdaten feldtaugliche Layer: NDVI-Analysen in 48 Stunden, Vektorisierung von Feldgrenzen, Zonenkarten in Minuten. Unsere Ingenieure vereinheitlichen ISOBUS-Maschinendaten verschiedener Hersteller, binden IoT-Boden- und Wettersensoren ein und schließen den Kreis mit Applikationskarten, die Maschinen direkt ausführen. So verbinden wir jede Datenquelle mit der Entscheidung auf dem Feld.
So arbeiten wir
In Großbritannien registriert
Verträge nach englischem Recht
DSGVO-konform
NDA ab Erstkontakt
Sichere Datenübertragung
Wir kennen Ihre Schmerzpunkte
Sechs operative Schwachstellen, die uns in dieser Branche immer wieder begegnen. Wenn drei davon Ihre sind, sollten wir sprechen.
Satellitenbilder gekauft, aber nicht verarbeitet
Die Bestandsanalyse erreicht die Agronomin nie, solange sie eine Entscheidung noch ändern kann.
Kein eigenes GIS-Team
Tausende Hektar erzeugen täglich Daten; niemand ist da, um sie zu verarbeiten, zu prüfen und zu pflegen.
Maschinendaten im Herstellersilo
Jedes Terminal hält seine eigenen, untereinander inkompatiblen Aufzeichnungen. Ein gemischter Fuhrpark bedeutet eine zerstückelte Feldhistorie.
Sechs Datenquellen, kein gemeinsamer Bildschirm
Satellit, Maschinen, Sensoren, Wetter, Boden und Feldbonitur treffen sich nie in einer operativen Sicht.
Generalistische Entwickler brauchen Monate
Feldgeometrien, Raster und Koordinatensysteme lassen sich aus der Webentwicklung nicht übertragen.
Pilotbetrieb-Abläufe brechen bei Skalierung
Was auf 1.000 ha von Hand funktioniert, scheitert auf 10.000. Wachstum vervielfacht die Handarbeit.
Vertraut von



10 Leistungen für Landwirtschaft & AgriTech, ein Qualitätsstandard
Zwei Teams, ein Partner. Die Produktionsabteilung macht aus rohen Satelliten- und Maschinendaten feldtaugliche Layer; die Softwareabteilung führt Sensoren, Maschinen und KI-Analytik zu einer operativen Sicht vom Satelliten bis zur Maschine zusammen.
Datenproduktion
48 hBildverarbeitung & NDVI
Bildverarbeitung & NDVI
Das Bild der Bestandsentwicklung in der Hand der Agronomin, solange es eine Entscheidung noch ändern kann. 8.000 ha NDVI in 48 Stunden statt der üblichen 7–10 Tage, mit Georeferenzierung, radiometrischer Korrektur, Schnittkantenbearbeitung und Mosaiken. So wird aus Bildmaterial, für das Sie bezahlt haben, eine Erkenntnis, nach der Sie diese Woche handeln können, nicht nächsten Monat.
Input: Rohbilder + Passpunkte
Output: GeoTIFF / ECW / MBTiles
2 Min.Zonenabgrenzung
Zonenabgrenzung
Bewirtschaftungszonen, fertig für die Maschine, statt drei Tage Schreibtischarbeit. Zonenkarten je Schlag über 15.000 ha in 2 Minuten statt in einem 3-Tage-Zyklus von Hand, formatiert für die teilflächenspezifische Ausbringung. So erreicht die Applikationskarte die Spritze oder den Streuer noch am Tag des Dateneingangs.
Input: Bilddaten / Ertragsdaten
Output: VRA-fertige Zonen
Vektorisierung von Feldgrenzen
Vektorisierung von Feldgrenzen
Der saubere Grenzlayer, auf dem jede weitere Betriebsauswertung aufsetzt. Digitalisierte, geprüfte Grenzen mit über die Saisons hinweg konsistenter Geometrie. So bauen Ertragskarten, Förderanträge und Zonenarbeit auf derselben verlässlichen Basis auf statt auf uneinheitlichen Tabellenblättern.
Input: Bilddaten / Aufzeichnungen
Output: SHP / GeoJSON
Gelände- & Monitoring-Layer
Gelände- & Monitoring-Layer
Die Gelände- und Monitoringbasis für Drainage, Planung und Entscheidungen während der Saison. DTM-/DSM-Oberflächen und Monitoring-Layer, über die Saison hinweg nach Ihrem Schema gepflegt. So bleibt das operative Bild aktuell, statt nach der Aussaat zu veralten.
Input: LiDAR / Bilddaten
Output: GeoTIFF-Layer
Dediziertes Back-Office-Team
Dediziertes Back-Office-Team
Ein eingebundenes, GIS-erfahrenes Team, das in Ihren Abläufen arbeitet: Bilddaten, Feldgrenzen und Felddaten nach Ihren Standards und Ihrem Auftrag verarbeitet, ohne Kosten und Vorlauf einer Festanstellung.
Input: Ihr Auftrag
Output: Ihr Team
Vier-Augen-QS bei jedem Ergebnis. Unter 7 % Nacharbeit. Ingenieurinnen und Ingenieure mit BSc+ in jedem Projekt.
Demo-Datensatz in 5 Arbeitstagen. Stimmen Qualität und Tempo, kalkulieren wir einen ersten Auftrag, ohne laufende Verpflichtung.
Demo-Datensatz senden →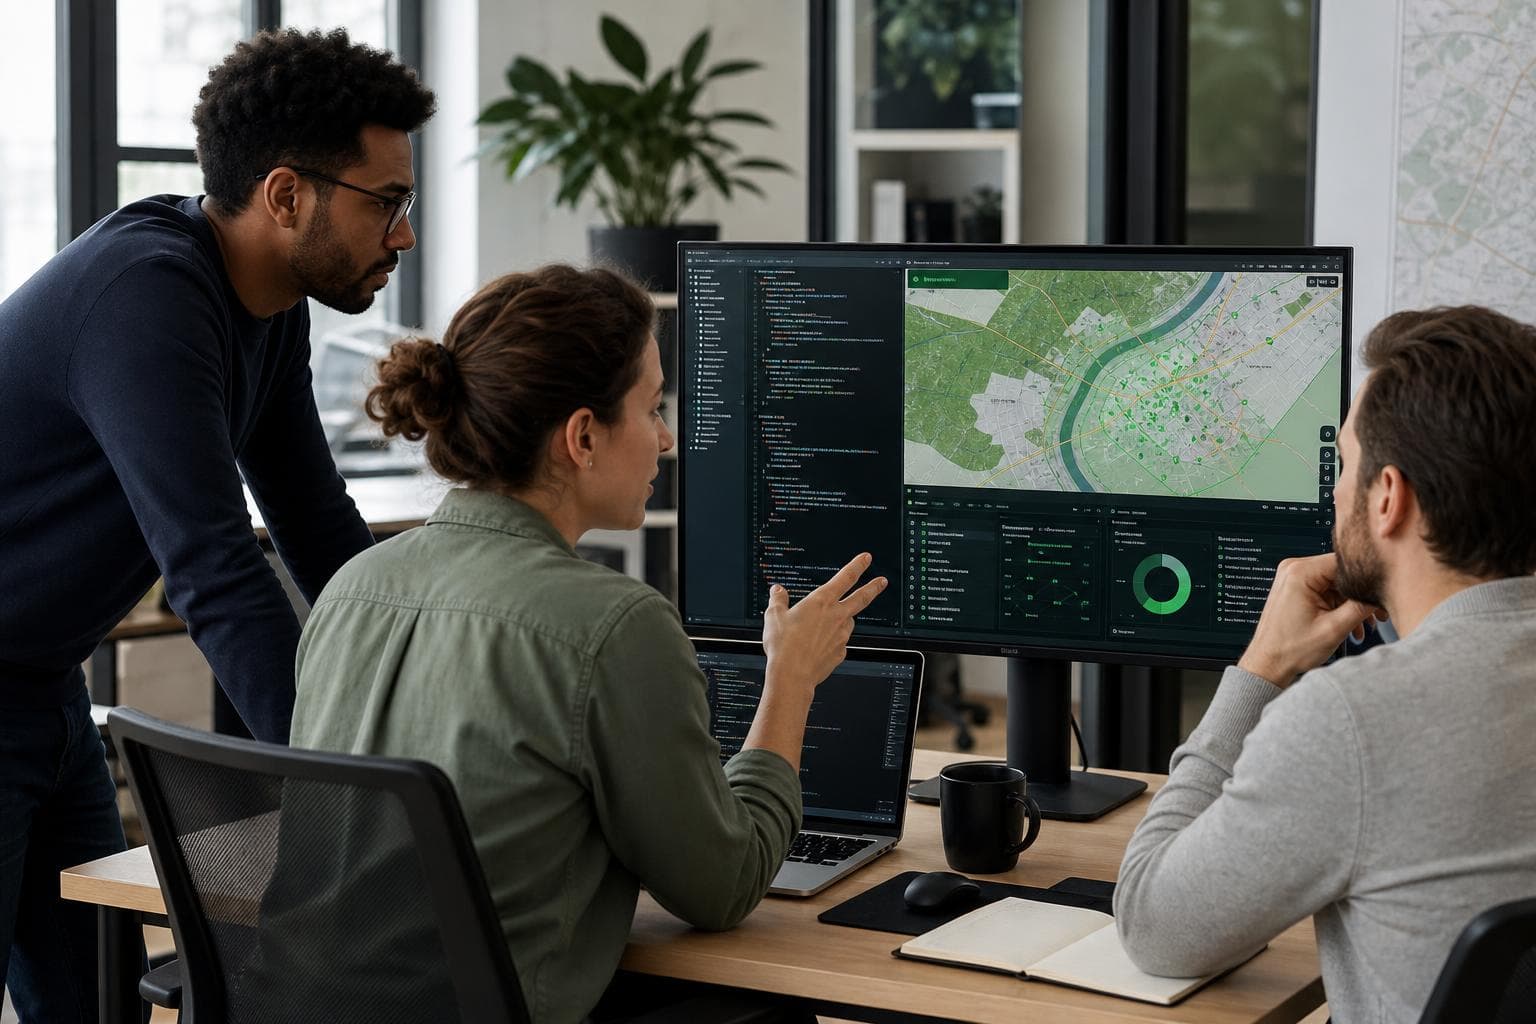
Softwareentwicklung
ISOBUS- & Maschinendatenplattformen
ISOBUS- & Maschinendatenplattformen
Ein gemischter Fuhrpark, endlich auf einer Karte lesbar. Sechs Marken vereinheitlicht: TC-GEO-, TC-SC- und TC-BAS-Auftragsdaten ausgewertet und visualisiert, mit VRA-Applikationskarten, die direkt auf der Maschine laufen. So ist die Historie eines Schlags nicht länger über inkompatible Terminals verstreut.
Input: Terminal-Exporte
Output: Einheitliche Flottenkarte
GeoAI-Bestandsanalytik
GeoAI-Bestandsanalytik
Bilddaten werden automatisch zu agronomischen Entscheidungen und anschließend fachlich geprüft. KI-gestützte Bestandsanalyse aus Satellitendaten und Unkrauterkennung aus Drohnendaten, wobei jedes KI-Ergebnis von Fachleuten geprüft wird. Sie erhalten eine belastbare Erkenntnis, keinen Black-Box-Wert.
Input: Bilddatenströme
Output: Agronomische Erkenntnis
IoT-Boden- & Wettermonitoring
IoT-Boden- & Wettermonitoring
Bodenfeuchte, Wetter und Sensordaten aus dem Bestand laufen in einem räumlichen Layer mit geofence-basierten Schwellenwerten zusammen. So lösen agronomische Bedingungen Warnungen auf der Karte aus, nicht in einem separaten Dashboard.
Input: Sensordaten
Output: Warnungen auf der Karte
Präzisionsplattformen im geschlossenen Kreislauf
Präzisionsplattformen im geschlossenen Kreislauf
Jeder Durchgang macht die nächste Applikationskarte besser. Bodensensoren, Wetter und Satellit in einer Ansicht zusammengeführt, im Ablauf Analyse → Applikationskarte → Maschine → As-Applied-Daten und zurück, mit AgroDataHub als Zusammenführung von sechs Quellen. So wird Precision Farming zu einem laufenden Kreislauf statt zu einzelnen Karten.
Input: 6 Datenquellen
Output: Eine operative Sicht
Parallelfahrsysteme & Feldnavigation
Parallelfahrsysteme & Feldnavigation
Zentimetergenaue Spurführung für die Maschinen, die die Arbeit machen. GPS-/GNSS-integrierte Navigation für Landmaschinen, damit Durchgänge sauber anschließen, Überlappungen und Fehlstellen kleiner werden und die geplante Applikation auch dort landet, wo sie im Feld vorgesehen war.
- GPS-/GNSS-integrierte Maschinenführung
- Genauigkeit im Zentimeterbereich
Input: Feld- + Maschinendaten
Output: Spurführungs-Layer
Jede Zeile Code, jedes Repository, jedes Schema gehört Ihnen bei der Übergabe. Keine zurückbehaltenen Rechte. Wir sind das Entwicklungsteam: Wir bauen, liefern und übergeben. Wir beraten nicht und verschwinden dann.
Technisches Gespräch buchen →Ergebnisse
Was Sie mit GIS-Point bekommen
Entscheidungen in 48 Stunden
Bestandsanalyse im Takt des Feldes, nicht im Takt der Saison.
Karten je Schlag in Minuten
Zonenabgrenzung in 2 Minuten statt in 3 Tagen.
Weniger Feldbegehungen
Das Monitoring-Dashboard senkte die Besuche der Agronomen um 30 %.
Gemischter Fuhrpark auf einer Karte
Sechs Maschinenmarken über ISOBUS vereinheitlicht.
Der Kreis schließt sich bis zur Maschine
Applikationskarten werden ausgeführt; die As-Applied-Daten verbessern den nächsten Durchgang.
Sechs Quellen, ein Bildschirm
Satellit, Sensoren, Wetter und Maschinen in einer Ansicht.
Technologie-Stack
Technologien und Werkzeuge, mit denen wir arbeiten
Plattformunabhängiger Stack auf offenen Standards. Produktionsreif, bei der Übergabe prüfbar und frei von Lizenzgebühren pro Arbeitsplatz. Unten steht der Stack, auf den wir uns standardmäßig stützen; bei Bedarf passen wir uns Ihrer bestehenden Umgebung an.
Geodatenbank & Speicherung
Eine schlagbezogene Datenwahrheit: Grenzen, Zonen, Raster und Maschinenspuren gemeinsam und skalierbar gespeichert.
PostgreSQL 15+PostGIS 3.xTimescaleDBS3 / object storage
Fernerkundung & Bilddaten
Von der rohen Satelliten- und Drohnenaufnahme zu NDVI, Klassifizierung und Zonenkarten, die die Agronomin tatsächlich öffnet.
Copernicus / Sentinel-2PlanetGDALRasterioOrfeo Toolbox
ETL, GeoAI & Analytik
Wiederholbare Strecken von Bild- und Ertragsdaten zu schlagbezogenen Zonen und VRA-fertigen Applikationskarten.
Python (GeoPandas, NumPy, Shapely)scikit-learnPyTorchApache Airflowdbt
ISOBUS & Maschinendaten
Auftragsdaten gemischter Flotten ausgewertet und auf einer Karte dargestellt; Applikationskarten zurück auf das Terminal geschrieben.
ISOBUS TC-GEO / TC-SC / TC-BASISOXMLJohn Deere Operations Center APIClimate FieldView API
Alle Ergebnisse werden auf offenen Standards geliefert. Quellcode, Schemata und Felddaten gehen bei der Übergabe an Sie über, ohne Lizenzgebühren pro Arbeitsplatz und ohne zurückbehaltene Rechte.
GeoAI & ML für Landwirtschaft & AgriTech. NDVI und Zonenabgrenzung über große Flächen in Stunden. Weniger Feldbegehungen, weil zuerst aus dem Bildmaterial gearbeitet wird. Jedes Ergebnis wird gegen einen Referenzdatensatz gemessen und von einer Ingenieurin oder einem Ingenieur mit BSc+ verantwortet.
Den gesamten GeoAI- & ML-Stack ansehenWarum Sie sich für uns entscheiden
Qualität, die Sie nachprüfen können
- Unter 7 % Nacharbeit, je Ergebnistyp erfasst
- Vier-Augen-QS bei jedem Ergebnis
- 100% BSc+ Geodaten-Ingenieure
Tempo, das gemessen wird
- Demo-Datensatz in 5 Arbeitstagen verarbeitet
- Namentlich benanntes Team in 2 Wochen einsatzbereit
- Monatlich auf 1–10+ Ingenieure skalieren
Zusammenarbeit am selben Tag
- MEZ/BST in Echtzeit für Großbritannien und die EU
- Lieferung über Nacht für Nordamerika
- Feste Projektleitung als einzige Ansprechperson
Eigentum ab dem ersten Tag
- Offene Standards: PostGIS, GeoServer, QGIS
- Der gesamte Code und alle Rechte gehören Ihnen bei der Übergabe
- Keine Lizenzen pro Arbeitsplatz, keine Bindung
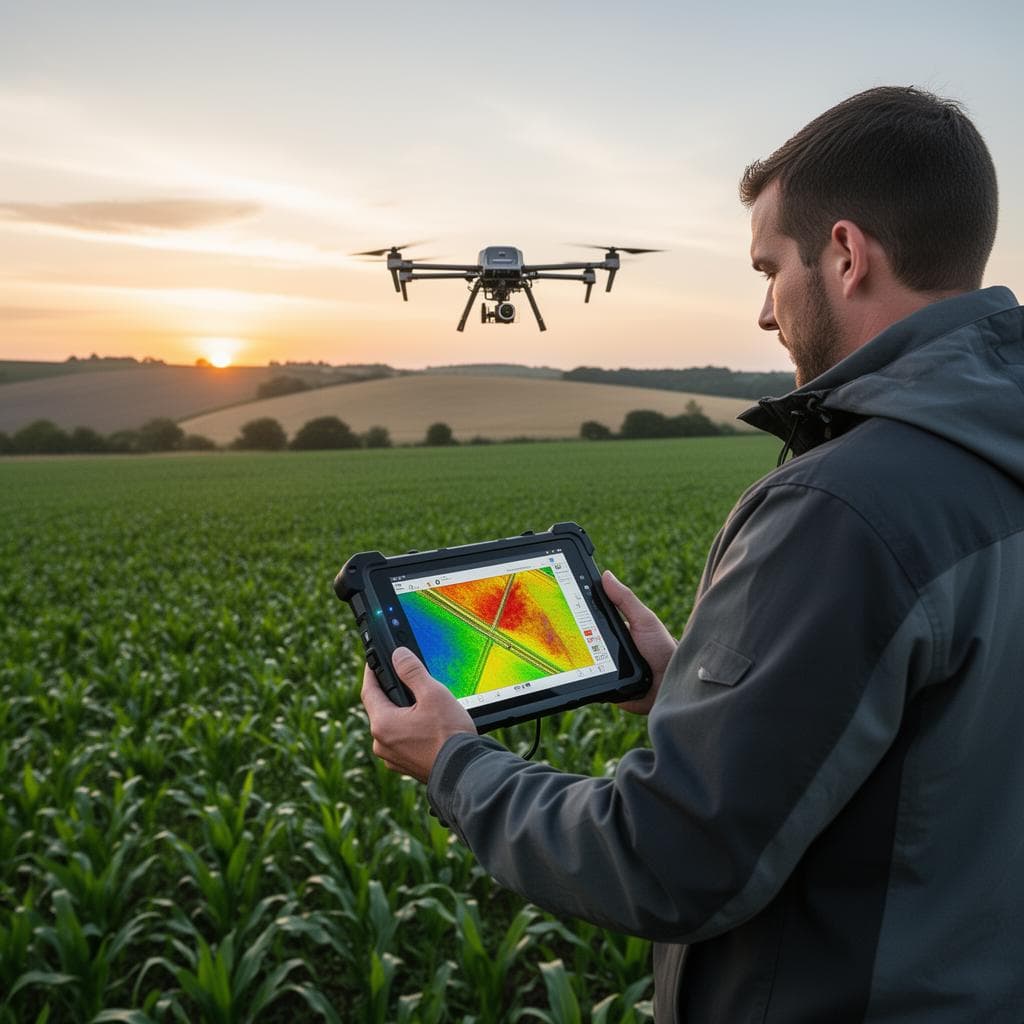
Die Daten sind längst auf Ihrem Betrieb. Die Entscheidungen nicht.
Senden Sie einen echten Betriebsdatensatz: Digitalisierung von Feldgrenzen oder ein Bilddatensatz, zurück in 5 Arbeitstagen.
Einblicke
Einen räumlichen IoT-Stack bauen: vom Sensor zur Karte
Architekturmuster, um LoRaWAN-, NB-IoT- und MQTT-Sensordaten nach PostGIS zu übernehmen und in unter 200 ms auf interaktiven Karten darzustellen.
ISOBUS-Analytik: Maschinendaten werden zu Feldwissen
Wie TC-GEO-, TC-SC- und TC-BAS-Daten aus sechs großen Maschinenmarken die Genauigkeit KI-gestützter Applikationskarten und Ertragsprognosen speisen.
Belege aus dieser Branche
Monitoring-Plattform für Präzisionslandwirtschaft
Ein AgTech-Start-up in Saudi-Arabien kam auf uns zu, um verstreute Agrardatenbestände in einer Oberfläche zusammenzuführen.
Plattform für digitale Bodenkartierung
Der Kunde brauchte ein Werkzeug, um Bodeninformationen aus Versuchsflächen, Fernerkundung und Bodenvorhersagemodellen zu bündeln und darzustellen (0–5 cm, 5–15 cm), mit interaktiver Abfrage und herunterladbaren Ergebnissen.