Making Asset Data Submission-Ready

Utilities face pressure from every direction: regulatory submission deadlines, an AMP8 cycle driving asset data volume past team capacity, records sitting in mixed formats and vintages, and errors that surface in the regulator's review instead of your own QA.
The answer is validated data and the software that keeps it consistent. Our production team delivers compliance gap analysis, standardisation to submission-ready format, and asset layer vectorisation; our engineers build web asset platforms, spatial ETL between your systems, and IoT-connected condition monitoring, connecting field assets to compliance without adding headcount.
How we work
UK-Registered Company
English-Law Contracts
GDPR Compliant
NDA from Intake
Secure Data Transfer
We know your pains
Six operational failures we see across this industry. If three of them are yours, we should talk.
AMP8 drives data past team capacity
The $114B cycle multiplies asset records faster than headcount can validate them.
Records in mixed formats and vintages
Decades of CAD, scans, and legacy GIS resist standardisation. Cleaning the data is the real project.
Errors surface in the regulator's review
Validation happens after submission instead of inside your own QA. Every rejection costs a cycle.
Legacy migration stalls every modernisation
New platforms wait on old data nobody has time to fix.
Asset systems hold conflicting truths
GIS, asset management, and field systems disagree on location, status, and attributes.
Reporting is rebuilt by hand each cycle
Every regulatory and internal report starts from manual data assembly across systems.
Trusted by





What we deliver for utilities & energy
Two teams, one partner. The GIS production department processes and standardises your asset data; the software department builds the platforms that keep it consistent.
Data Production
Regulatory Data Preparation
Regulatory Data Preparation
Asset data made submission-ready before it ever reaches a regulator. We run a compliance gap analysis, standardise to the submission specification, and validate inside your QA, so errors are caught by us, not bounced back in review, and you meet the deadline without adding headcount.
- Compliance gap analysis with remediation report
- Standardisation to submission-ready format
- Validated before it leaves your organisation
Input: Raw asset records / mixed formats
Output: Submission-ready data
LiDAR Corridor & Powerline Processing
LiDAR Corridor & Powerline Processing
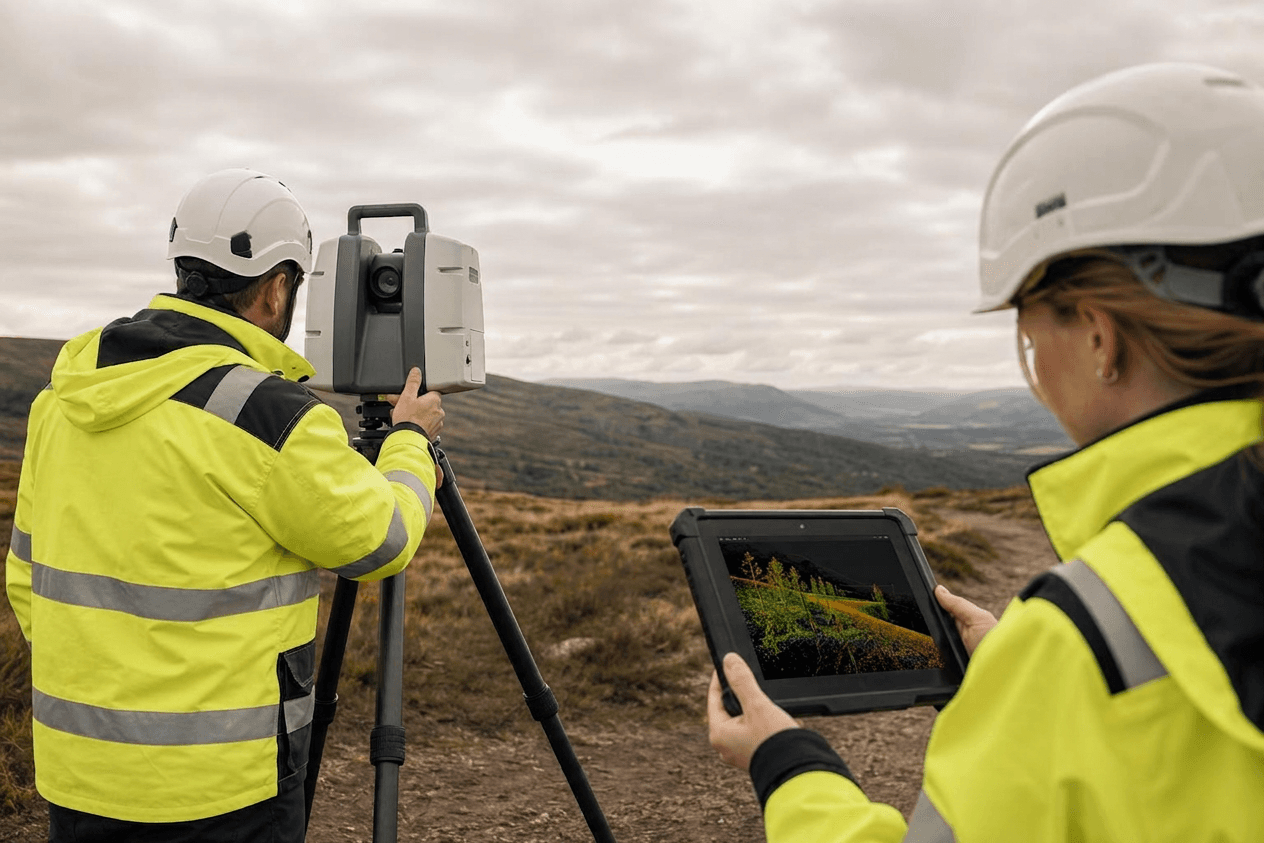
Corridor scans turned into the layers your vegetation management and inspection teams act on. Powerline extraction and vegetation layers with ground/off-ground classification at 97% accuracy, so encroachment and clearance work runs on accurate data, not last year's survey.
- Powerline extraction and vegetation layers
- Ground/off-ground classification at 97% accuracy
Input: LAS / LAZ
Output: Classified corridor layers
Terrain Modelling (DEM / DTM / DSM)
Terrain Modelling (DEM / DTM / DSM)
The surface base your flood and subsidence models build on. DEM/DTM/DSM from LiDAR or survey data with contours and breaklines, so risk modelling starts from accurate ground, not approximation.
- DEM/DTM/DSM from LiDAR or survey data
- Contour generation and breakline editing
Input: LAS / XYZ
Output: GeoTIFF / ASCII
Asset Layer Vectorisation
Asset Layer Vectorisation
Decades of mixed records turned into clean, validated GIS layers at production speed. Network and asset feature extraction with topology validation, 5–10× faster than manual, delivered to your target schema, so legacy data stops blocking every modernisation project.
- Network and asset feature extraction
- Topology validation in every workflow
- Output in SHP/GML to your target schema
Input: CAD / scans / legacy records
Output: Validated GIS layers
GIS Data Operations
GIS Data Operations
The ongoing upkeep that keeps your spatial database clean as volume grows. Format and legacy migration, deduplication, and CRS reprojection under dual-review QA at under 7% rework, so your asset data stays trustworthy through every investment cycle.
- Format and legacy migration
- Deduplication and CRS reprojection
- Dual-review QA, under 7% rework
Input: Mixed formats / legacy data
Output: Clean spatial database
Dedicated Asset Data Team
Dedicated Asset Data Team
A data team that absorbs AMP8 volume without you hiring for it. 1–10+ named engineers and a dedicated project manager, operational in two weeks, scaling with the investment cycle, so capacity follows the workload instead of a recruitment timeline.
- 1–10+ named engineers, dedicated project manager
- Operational in 2 weeks
- Scales with investment-cycle workload
Input: Your workload
Output: Named team
Imagery Processing (Orthophoto & Mosaic)
Imagery Processing (Orthophoto & Mosaic)
Inspection and corridor imagery turned into georeferenced basemaps your asset teams can work from. UAV and aerial georeferencing, radiometric correction, and mosaicking, so drone surveys of substations, lines, and sites become usable map layers, not folders of raw frames.
- UAV and aerial georeferencing, radiometric correction
- Mosaic production and tiling
Input: Raw imagery + GCP
Output: GeoTIFF / ECW / MBTiles
Dual-review QA on every deliverable. Under 7% rework. BSc+ engineers on every project.
Demo dataset in 5 working days. If the quality and speed are right, we scope a priced first job, with no standing commitment.
Send a Demo Dataset →
Software Engineering
Web Asset Platforms
Web Asset Platforms
One consistent view of the network for every team that touches it. Network, status, and inspection records unified with role-based access for office and field, on PostGIS and GeoServer with no per-seat lock-in, so GIS, asset management, and field crews stop disagreeing on the same asset.
- Network, status, and inspection records unified
- Role-based access for office and field
- PostGIS and GeoServer, with no per-seat lock-in
Input: Disconnected asset systems
Output: Unified web platform
Spatial ETL & Reporting
Spatial ETL & Reporting
The end of rebuilding the same report by hand every cycle. Automated pipelines connecting GIS, asset management, and field systems at 3–5× manual throughput, producing repeatable regulatory and compliance reports, so reporting runs itself instead of consuming a team.
- GIS connected to asset management and field systems
- 3–5× throughput vs manual handling
- Repeatable regulatory and compliance reporting
Input: GIS + asset + field systems
Output: Automated reports
IoT Monitoring & Predictive Maintenance
IoT Monitoring & Predictive Maintenance
Sensor data on the asset map, turning condition into action before failures happen. Integration via LoRaWAN, NB-IoT, and MQTT with geo-zonal alerts by asset and location, plus flood and subsidence risk models fed by live data, so monitoring becomes prediction, not a quarterly review.
- Sensor integration via LoRaWAN, NB-IoT, MQTT
- Geo-zonal threshold alerts by asset and location
- Flood and subsidence risk models fed by live sensor data
Input: Sensor streams
Output: Live asset map + alerts
Digital Twins & Structural Health
Digital Twins & Structural Health
Scans, models, and live sensors fused into one queryable 3D environment. LiDAR, BIM, and GIS terrain in the browser with strain, vibration, and tilt sensors mapped to asset models and long-term deformation tracking, so structural health is watched continuously, with alerts before a problem becomes a failure.
- LiDAR, BIM, and GIS terrain in browser-based 3D
- Strain, vibration, and tilt sensors mapped to asset models
- Long-term deformation tracking with alerts
Input: LiDAR / BIM / sensors
Output: Query-ready 3D twin
Offline-First Field Apps
Offline-First Field Apps
Tools that keep working where the signal does not. Mobile apps with offline mode and sync on reconnection, live crew positions on the office map, and in-field capture straight into the asset database, so inspection and maintenance data flows in from anywhere, not just where there is coverage.
- Mobile apps with offline mode and sync on reconnection
- Live crew positions and telemetry on the office map
- In-field data capture straight into the asset database
Input: Field workflow requirements
Output: Offline-first mobile apps
Predictive Spatial Modelling
Predictive Spatial Modelling
Risk you can see before it happens, not after. Flood, wildfire, and subsidence risk models fed by live IoT sensor data for continuous prediction updates, so asset planning and emergency response work from a current risk picture, not a study from last year.
- Flood, wildfire, subsidence risk models
- Continuously updated from live sensor data
Input: Sensor + spatial data
Output: Live risk models
Legacy GIS Modernisation
Legacy GIS Modernisation
Move decades of asset GIS off ageing on-premise systems without losing data integrity. On-premise to cloud, desktop to web, with geodatabase consolidation and performance optimisation, so your asset platform stops being a maintenance burden and starts scaling with the investment cycle.
- On-premise to cloud, desktop to web
- Geodatabase consolidation and performance tuning
Input: Legacy GIS
Output: Modern cloud platform
Multi-Source Spatial Fusion
Multi-Source Spatial Fusion
Every data source about an asset on one map. IoT ground truth, satellite, drone, and operational data fused with correlation analysis across sources, so condition, environment, and history are read together, not in separate silos.
- IoT, satellite, drone, operational data on one map
- Correlation analysis across sources
Input: Disconnected sources
Output: One fused map
Every line of code, every repository, every schema is yours on handover. No retained IP. We are the engineering team: we build, ship, and hand over. We do not consult and walk away.
Book a Technical Session →Outcomes
What you get with GIS-Point
Submission-ready asset data
Standardised, validated, formatted before the deadline.
Errors caught in your QA
Validation happens before the regulator sees the data.
No added headcount
Compliance met without recruitment overhead.
One view across systems
GIS, asset management, and field data finally agree.
Reports that rebuild themselves
Repeatable pipelines replace manual assembly each cycle.
Condition data on the map
Live telemetry with geographic threshold alerts.
Technology stack
Technology and tools we use
Platform-agnostic, open-standards stack. Production-grade, auditable on handover, and free of per-seat licensing. Below is the working stack we standardise on; we adapt to your existing environment when required.
Spatial database & storage
Authoritative asset of record: versioned, topology-aware, sub-200ms queries at network scale.
PostgreSQL 15+PostGIS 3.xpgRoutingTimescaleDBS3 / object storage
Map servers & APIs
OGC-compliant publication of WMS, WMTS, WFS and vector tiles for office and field consumers.
GeoServerMapServerpg_tileservpg_featureservMapProxy
ETL, validation & conflation
Repeatable pipelines from CAD, scans and legacy GIS into submission-ready schemas with dual-review QA.
FMEGDAL / OGRPython (GeoPandas, Shapely)Apache Airflowdbt
Desktop & QA tooling
Engineering cockpit for cartography, topology checks and pre-submission validation.
QGISArcGIS Pro (when required)JOSMGRASS GISMergin Maps
All deliverables ship on open standards. Source code, schemas and repositories are transferred on handover, with no per-seat licensing and no retained IP.
GeoAI & ML for Utilities & Energy. Features classified and checked against the data model automatically. Anomalies and gaps flagged before submission. Every output measured against a benchmark and owned by a BSc+ engineer.
See the full GeoAI & ML stackWhy you’ll choose us
Quality you can verify
- Under 7% rework rate, tracked per deliverable
- Dual-review QA on every output
- 100% BSc+ geospatial engineers
Speed that is measured
- Demo dataset processed in 5 working days
- Named team operational in 2 weeks
- Scale 1–10+ engineers monthly
Same-day collaboration
- CET/BST real-time for UK and EU
- Overnight delivery for North America
- Named project manager, single point of contact
Ownership from day one
- Open standards: PostGIS, GeoServer, QGIS
- All code and IP yours on handover
- No per-seat licences, no lock-in

Regulators set the deadlines. We make the data ready.
Send sample asset records: compliance gap analysis and remediation path in 5 working days.
Insights
Regulatory Data Preparation Guide
What UK regulators actually check in spatial data submissions, and how to prepare asset records that pass first time.
Building a Spatial IoT Stack: From Sensor to Map
How sensor networks, telemetry and asset records combine into one live spatial view of a distributed network.