
Software EngineeringFibre & Telecom
A Drone Inspection Platform for Cell Towers
16 defect typesdetected, located on the 3D tower and compared with the previous flight
A geo platform that turns drone flights around cell towers into repair orders. Every tower in the network sits on one map, every tower has a 3D model from its latest flight, and every defect has a position on the structure, a severity, photo evidence and a history across inspections. Detection models propose the defects; an inspector confirms them before anything reaches a work order.
Project snapshot
Built for tower owners, mobile operators and the inspection contractors who work for them. They fly drones around thousands of lattice towers, monopoles and guyed masts, and what comes back is a folder of a thousand photos per tower that someone has to go through by eye, with the findings typed into a spreadsheet or a PDF report.
- Location
- Delivered remotely, any region
- Duration
- 2-week discovery, then a 6 to 8 week pilot on 15 towers
- Engagement
- Project-based
- Team
- 2 engineers
Stack
- Data & AI
- PyTorch, object detection and segmentation models, OpenCV
- Survey & CAD
- Photogrammetry, LiDAR point clouds, PDAL, Open3D
- Backend
- Python, FastAPI, PostgreSQL with PostGIS, background workers
- Frontend
- React, TypeScript, MapLibre GL, three.js
- Infrastructure
- Docker, S3-compatible object storage
The challenge, and what closed it
Business challenge
A drone flight is quick; what follows it is not. Every tower produces 800 to 1,500 photos, and turning them into a list of repairs is manual review work that grows with the size of the network. Findings end up in per-tower reports that cannot be compared across the network, so nobody can say which towers need a climb crew first.
What we did
The platform sits between the drone crew and the maintenance team. The network map colours every tower by its worst open issue and totals the repair hours per crew work area, so planning starts from the map instead of from a pile of reports. Confirmed issues become work orders with deadlines set by severity, and tower tenants see the same view in the browser.
Technical challenge
A defect is only useful with a position on the structure, and a photo does not have one: the same corroded spot appears in six photos from six angles. Some defects are not visible in any single photo at all - antenna tilt, a bent member, guy wire sag - and have to be measured on geometry instead.
What we did
Photos from an automated orbit become a georeferenced 3D model. Detection models scan every full-resolution photo in tiles, and because the reconstruction knows where each photo was taken from, detections of the same spot from different photos merge into one issue with a 3D position. Issues that are geometry rather than appearance are measured on the model or the LiDAR scan: antenna tilt and azimuth by plane fitting, bent members against a straight line, guy wire sag by curve fitting.
Delivery challenge
A defect that was already there last year and one that appeared since both look the same in a photo. Without matching each finding to the previous inspection, every flight starts from zero and nobody can tell whether a tower is getting worse.
What we did
Each issue is matched to the previous inspection by type and position on the tower and marked new, worse, unchanged or fixed. No issue reaches a work order or a report until an inspector has confirmed it, and every confirm or reject is saved as a labelled example for the next training round, so the models learn the customer’s own towers.
Why us
Most of the hard part is not the detection model; it is putting a detection in the right place and knowing whether it is new. That is photogrammetry, point clouds and change detection, which is the geospatial work we do every day, from LiDAR vectorisation of overhead lines to 3D point-cloud viewers in the browser. The machine learning is built around an inspector who stays in control, because on safety-critical structures the useful question is not how often a model is right but whether a person checked it.
- Weeks 1-2
Discovery
Agree the issue catalogue and severity rules against the customer’s existing defect codes, import the tower register, and label a sample of past inspection photos to tune the models.
- Weeks 3-10
Pilot
Fly 15 towers across two crew areas. Deliver 3D models, reviewed issues and the first work orders, and measure model accuracy against a full manual review of the same towers.
- Then
Rollout by region
Add the remaining towers on a yearly inspection cycle, connect work orders to the maintenance system, and give tenants read-only access.
Results
What the platform covers out of the box. Detection accuracy is not listed here on purpose: it depends on the towers, the cameras and the defect codes, so the pilot measures it on the customer’s own towers against a full manual review - the share of real defects found, the share of suggestions inspectors confirm, and review time per tower.
16defect types across structure, antennas, safety and site
5detection methods: photo models, 3D model, LiDAR, calibrated photos, dusk flight
800-1,500geotagged photos per tower, about 40 minutes on site
7 / 30 daysrepair deadlines for critical and major issues
What we delivered
Network map
Every tower coloured by its worst open issue from the latest flight, with coverage range, crew work areas and the repair hours each area adds up to.
3D tower view
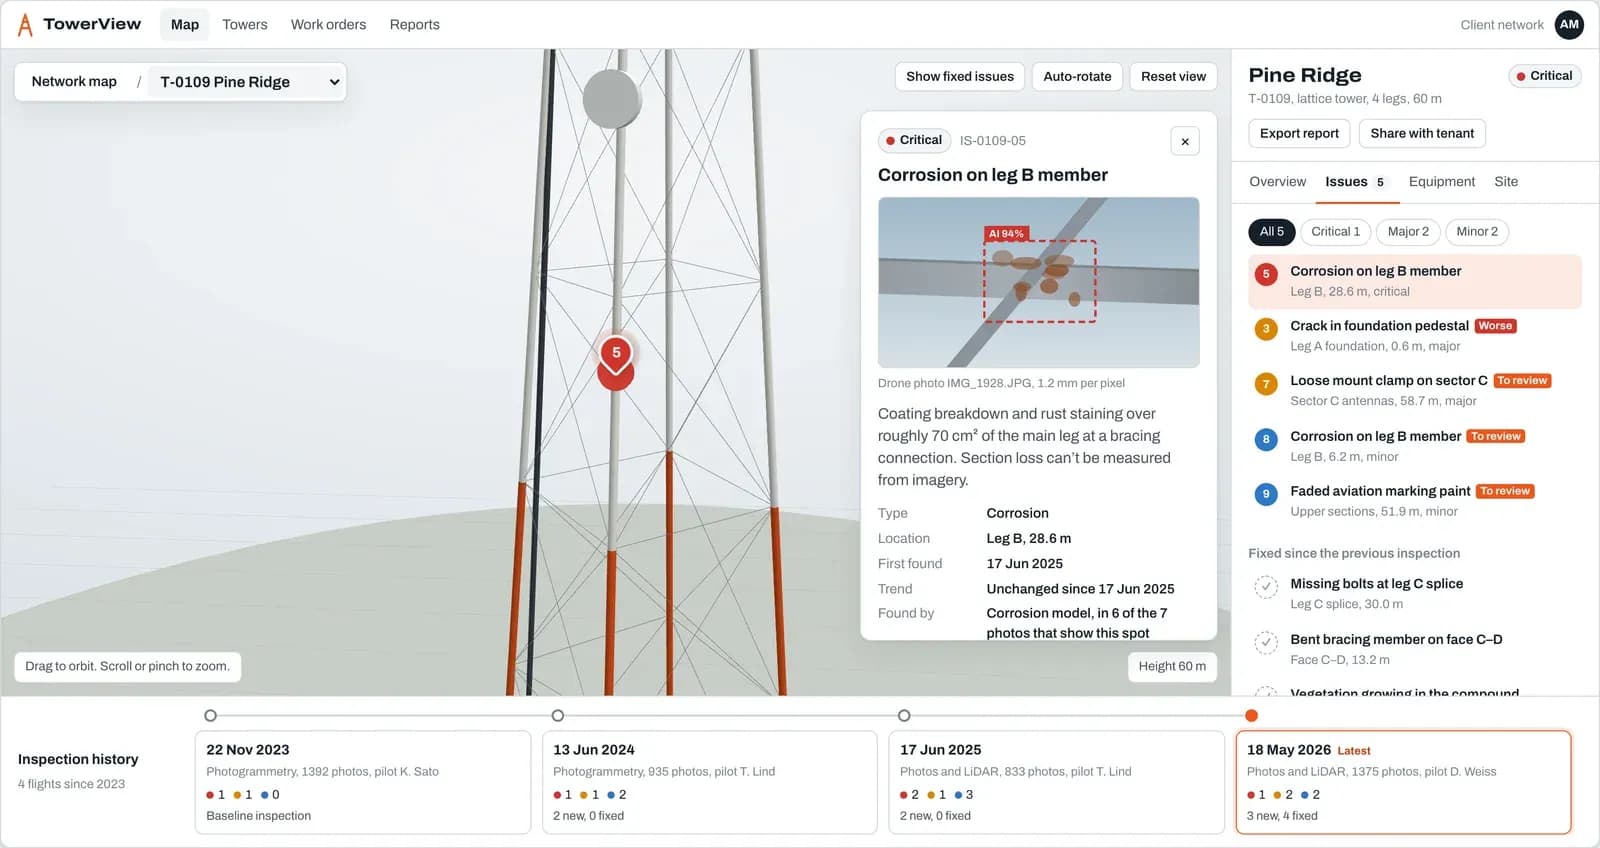
Orbit the model from the latest flight, click a pin to read the issue with its photo evidence, and switch between dated inspections to see what is new, worse or fixed.
Defects placed on the structure
Detections of the same spot from different photos merge into one issue with a leg, a height and a face, instead of six separate findings in six photos.
Measured, not just flagged
Corrosion area in cm², bolts found against bolts expected, antenna tilt in degrees, member deviation in millimetres, crack length, guy wire sag compared across the wires.
Inspector review and learning loop
Each issue type has its own confidence threshold. An inspector confirms or rejects every suggestion, and each decision becomes a training example for the next round.
Work orders and reports
Confirmed issues turn into work orders for climb crews with deadlines set by severity, plus a per-tower report and a read-only view for tenants.
On-site photo check
Blurred, over-exposed or poorly overlapping photos are flagged while the crew is still at the tower, so a re-fly takes minutes instead of a second trip.
In more detail
A drone can fly a cell tower in about forty minutes. What it brings back is 800 to 1,500 photos, and somewhere in them are the loose bolts, the corrosion at a bracing connection and the antenna that has drifted off its design tilt. Finding those by eye, tower after tower, is where inspection programmes spend their time.
TowerView turns the flight into a dated inspection. The photos become a georeferenced 3D model of the tower. Detection models, each trained for one issue type, scan every full-resolution photo and outline anything suspicious with a confidence score. Because the reconstruction knows where each photo was taken from, the six photos that show the same corroded spot on leg B produce one issue at one height, not six findings.
Not every defect is best found in a photo. Antenna tilt and azimuth are measured by fitting planes to each panel on the 3D model, bent members by comparing each one with a straight line, guy wire tension by fitting a curve to each wire in the LiDAR scan. Aviation marking is checked against a colour reference, and obstruction lights in a dusk flight. The platform measures each issue and applies the customer’s own severity rules to suggest a grade.
Then it compares. Each issue is matched to the previous inspection by type and position, so the inspector sees at once that the corrosion on leg B has grown since last June, that the missing bolts at the leg C splice were fixed, and which three issues are new.
Nothing reaches a work order until a person has confirmed it. Thresholds are set per issue type, low where a miss is dangerous and high where it is cosmetic, and every confirm or reject goes back into training. The network map then shows every tower by its worst open issue, and the repair hours per crew area, so the maintenance team plans from one screen.
Project gallery
Flying towers and reviewing the photos by hand?
Send us a tower register and a set of past inspection photos. We will show you what the platform finds on your own towers and scope a pilot around your defect codes.