Project Details
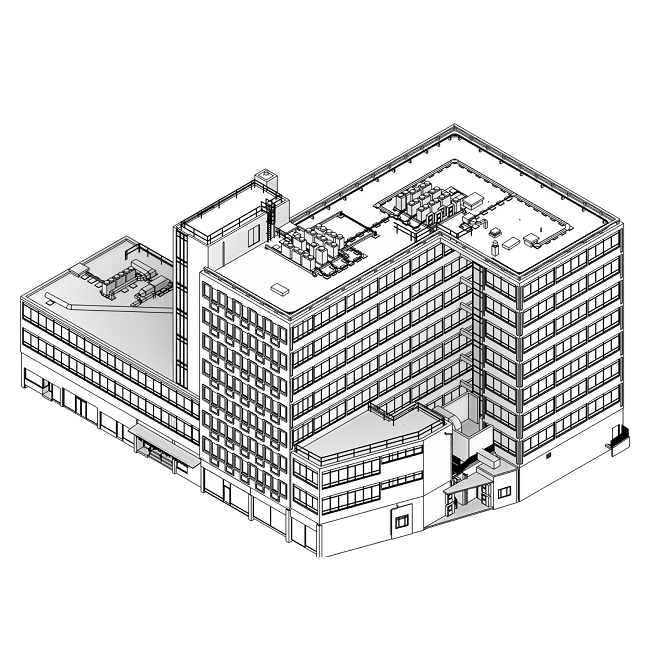
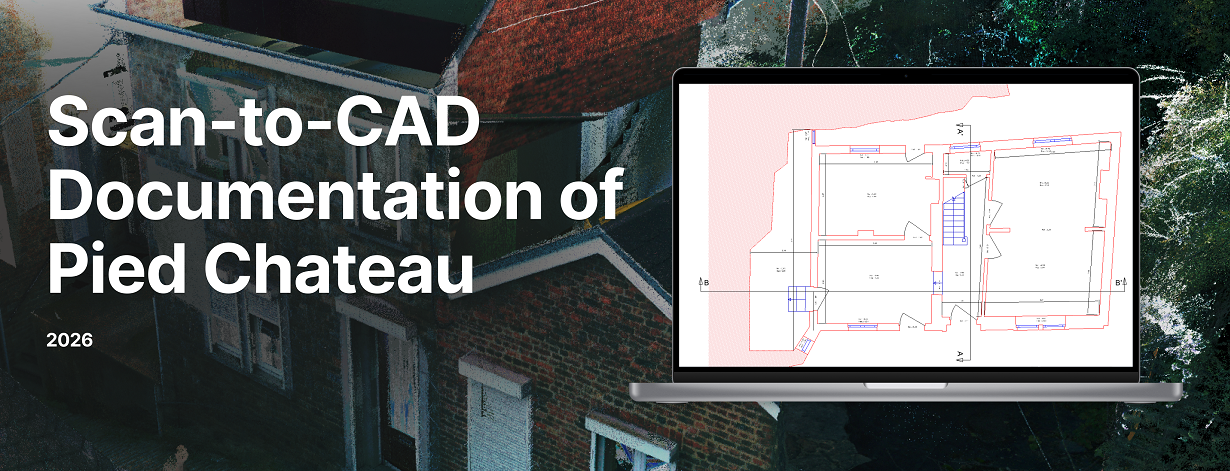
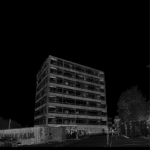
GIS-Point was engaged to process the laser scan data and produce accurate architectural drawings of the building.
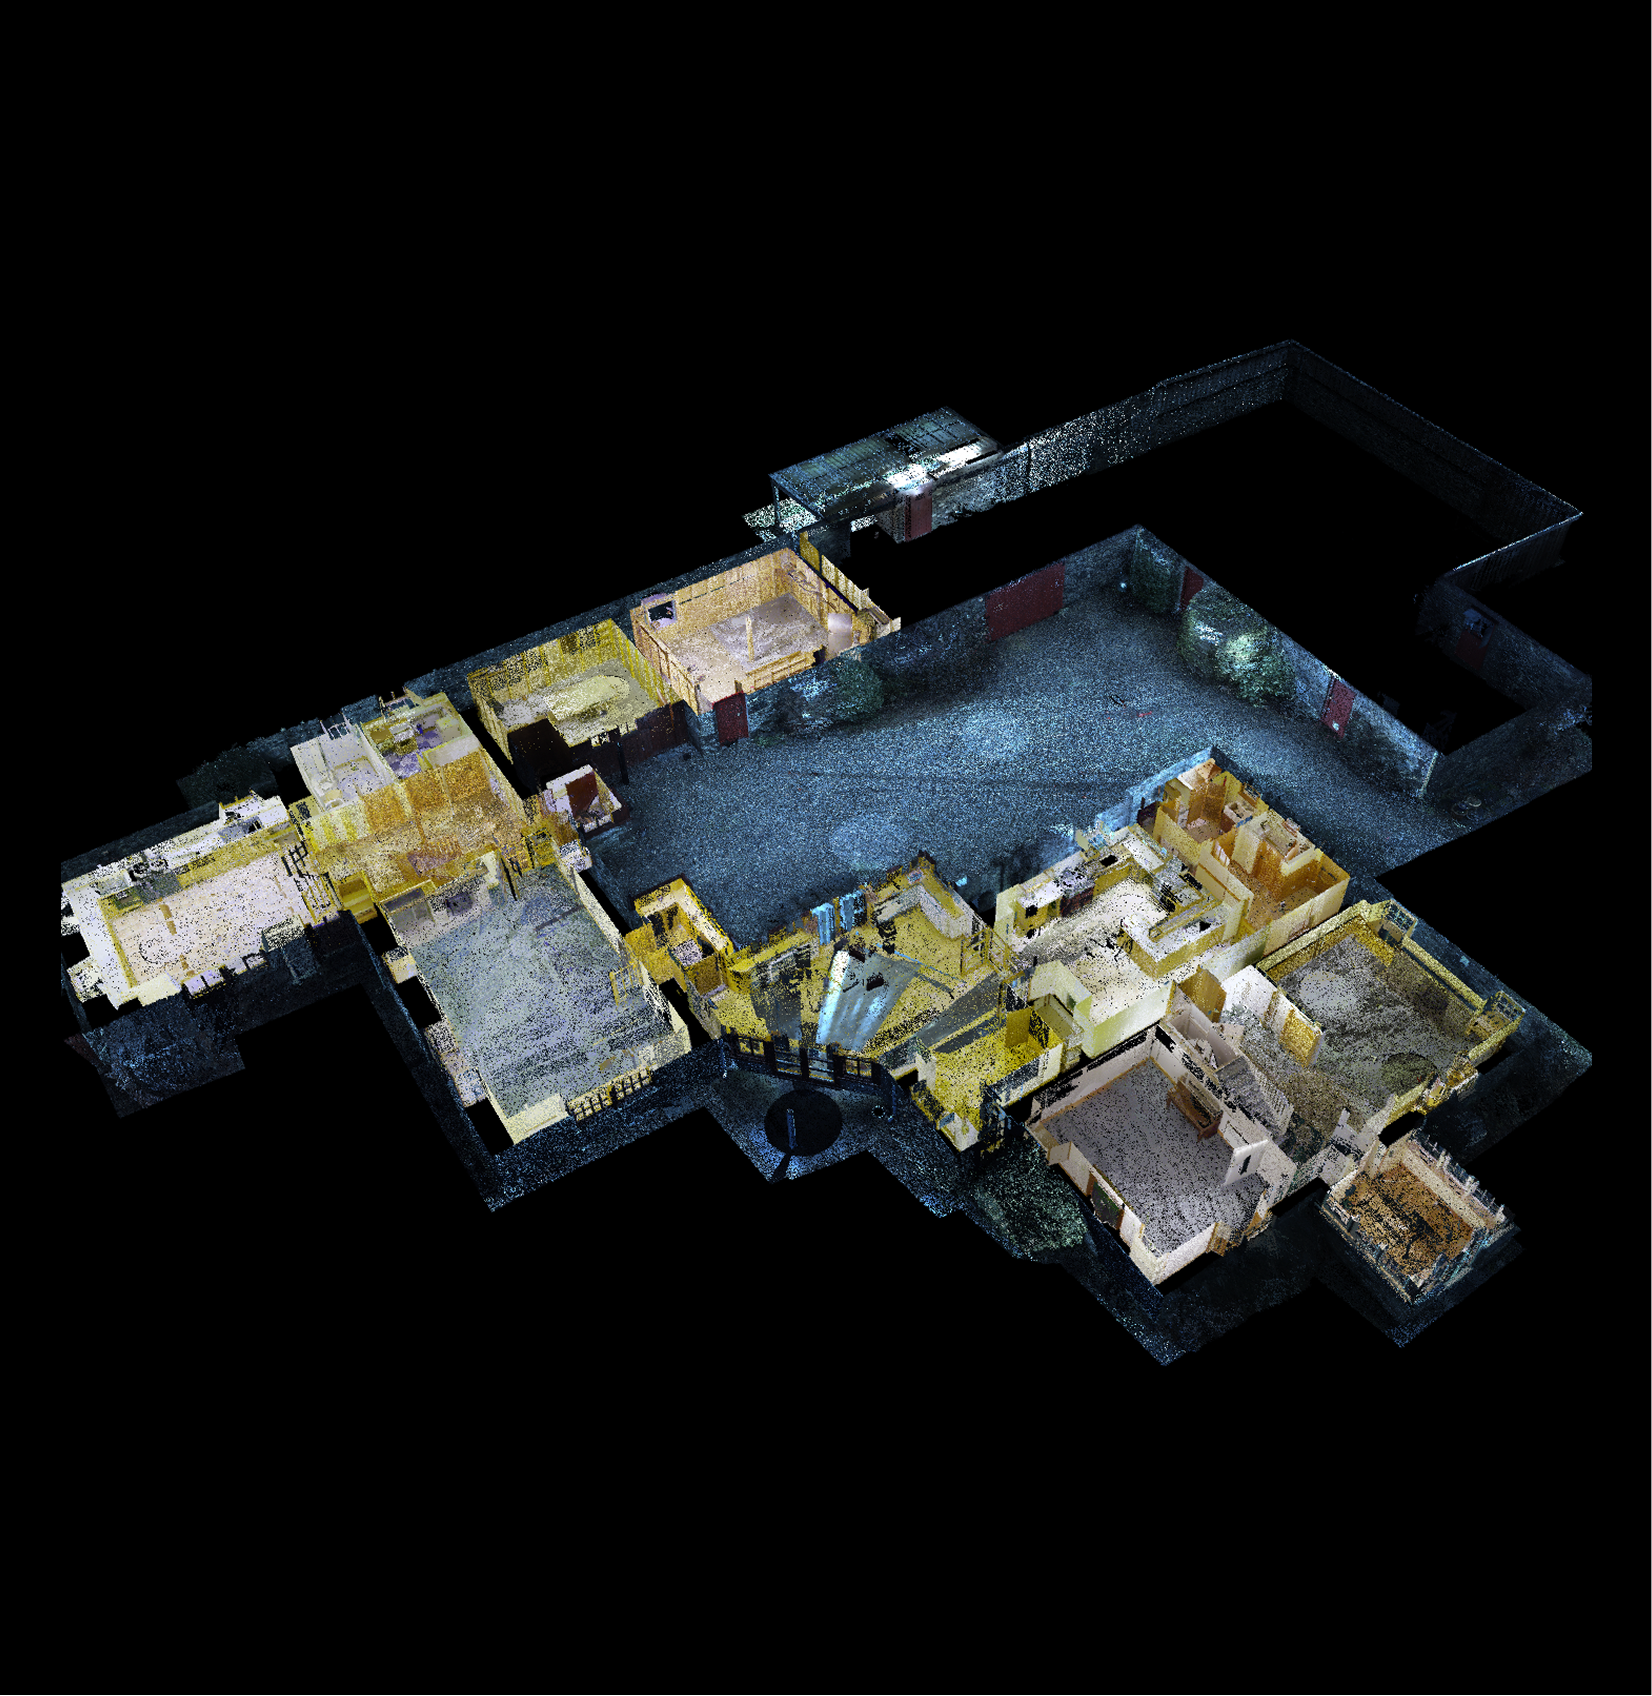
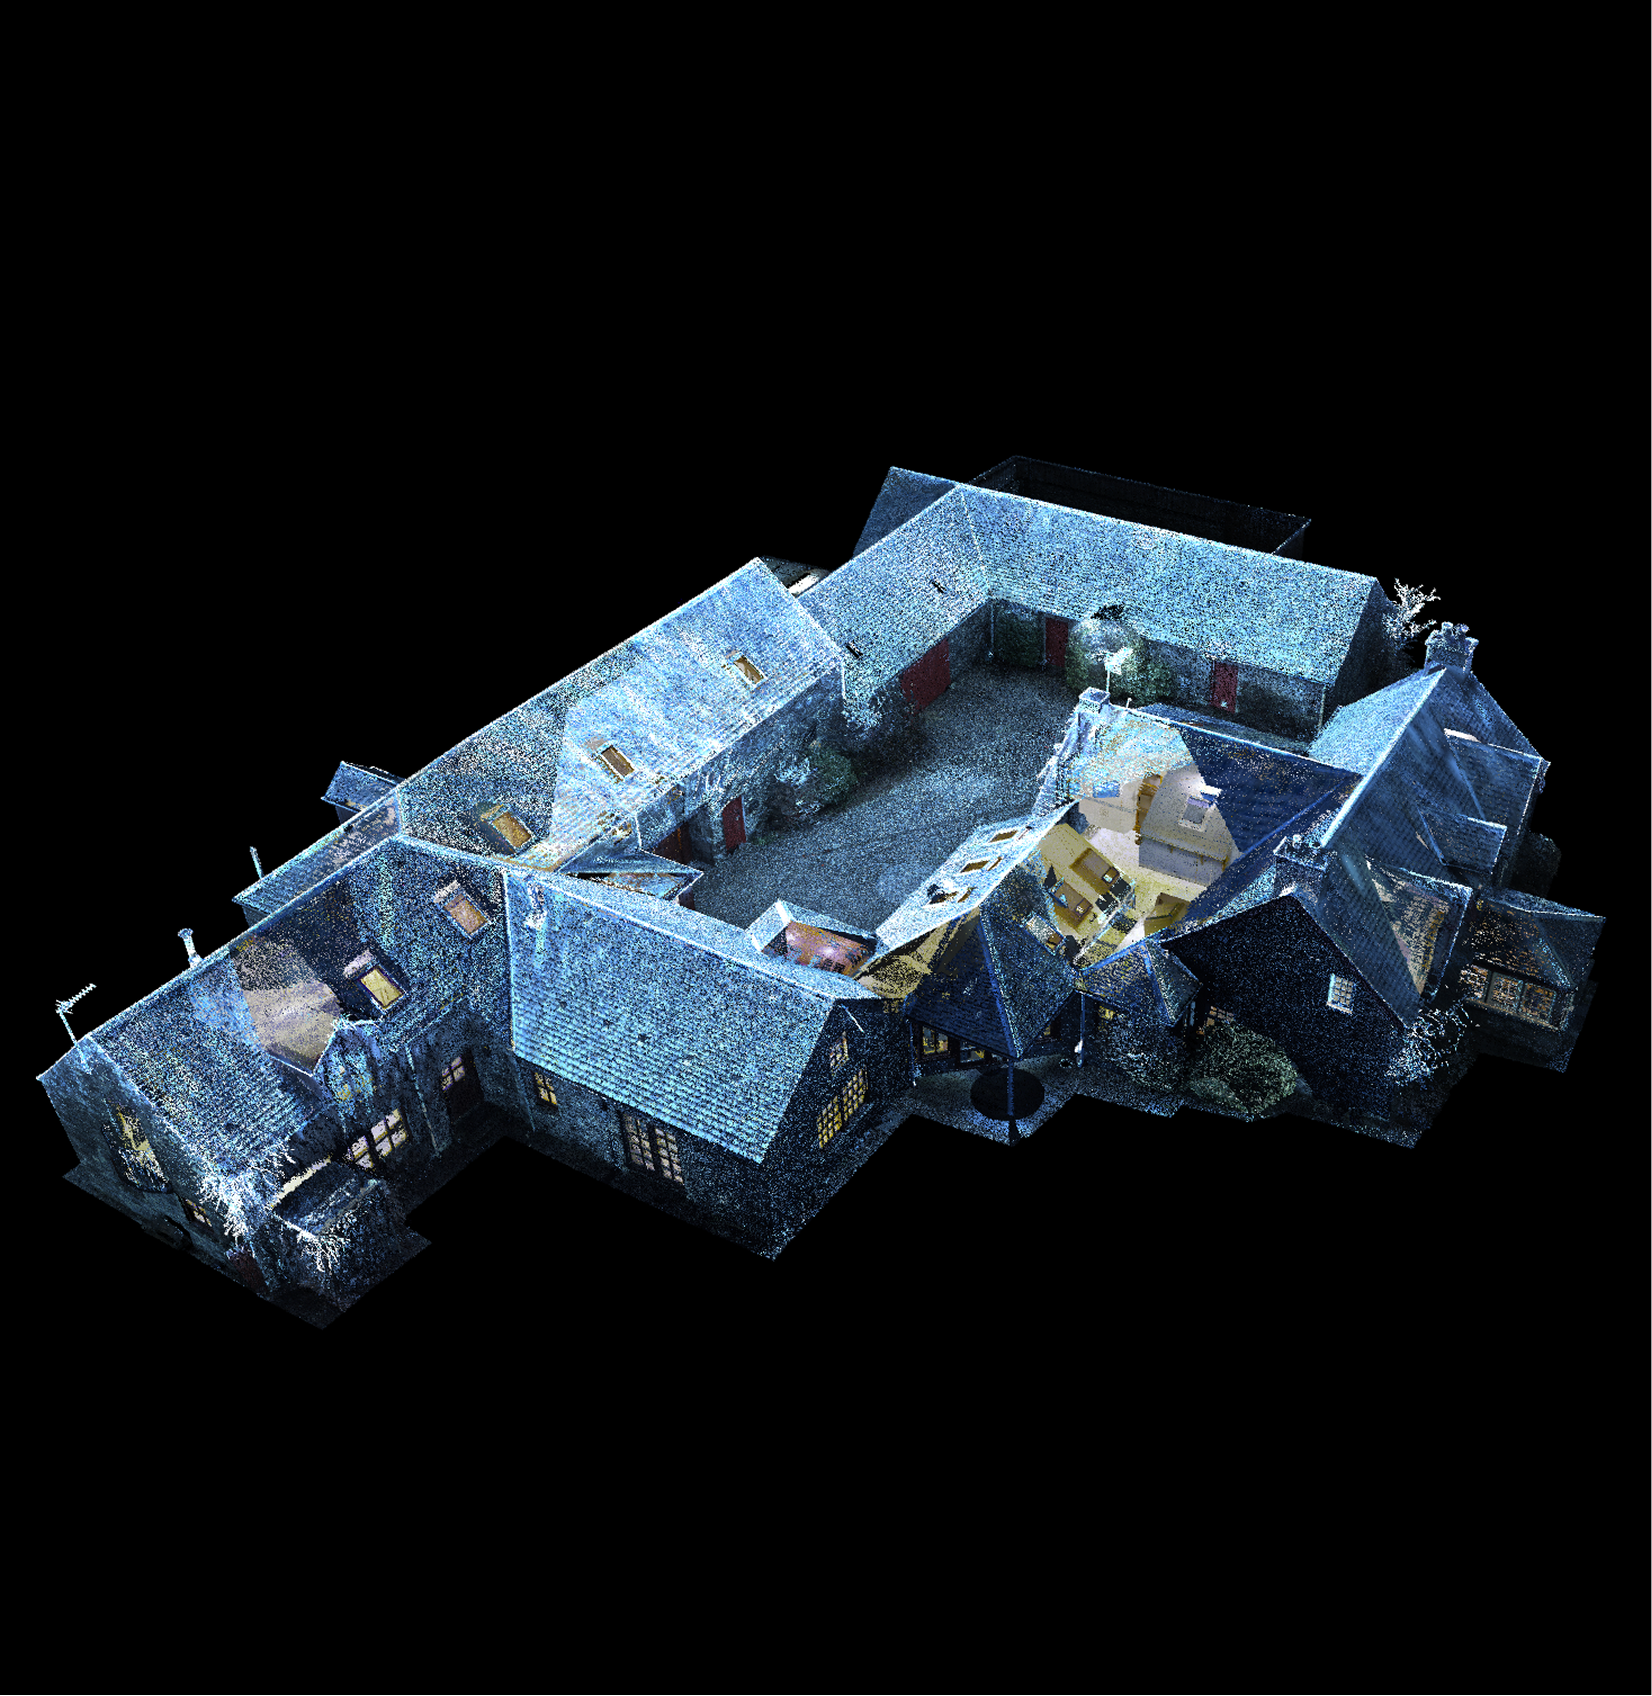
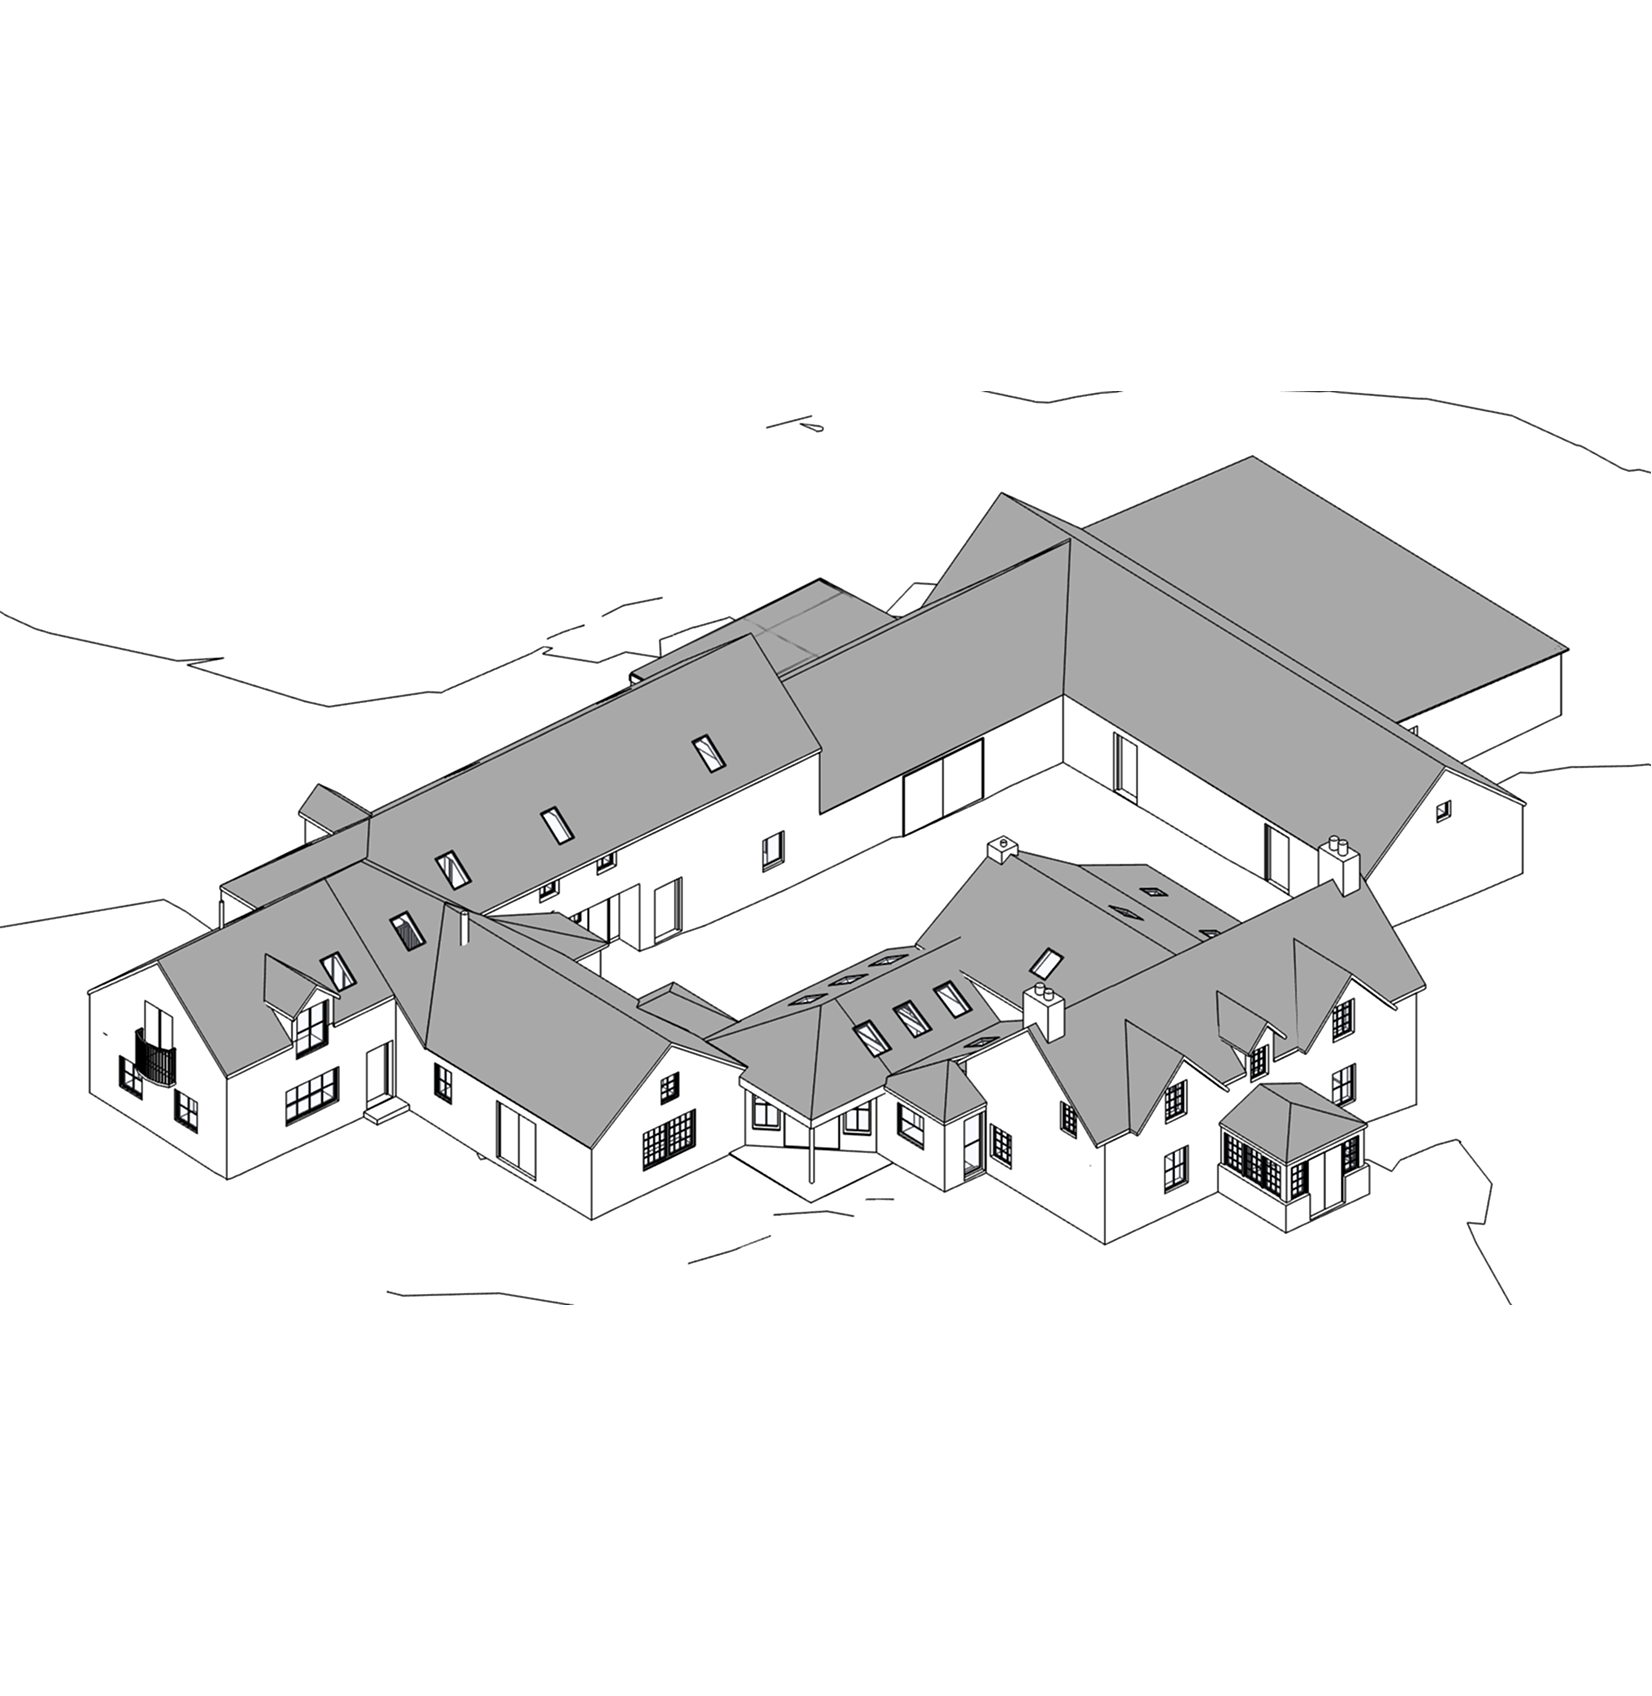
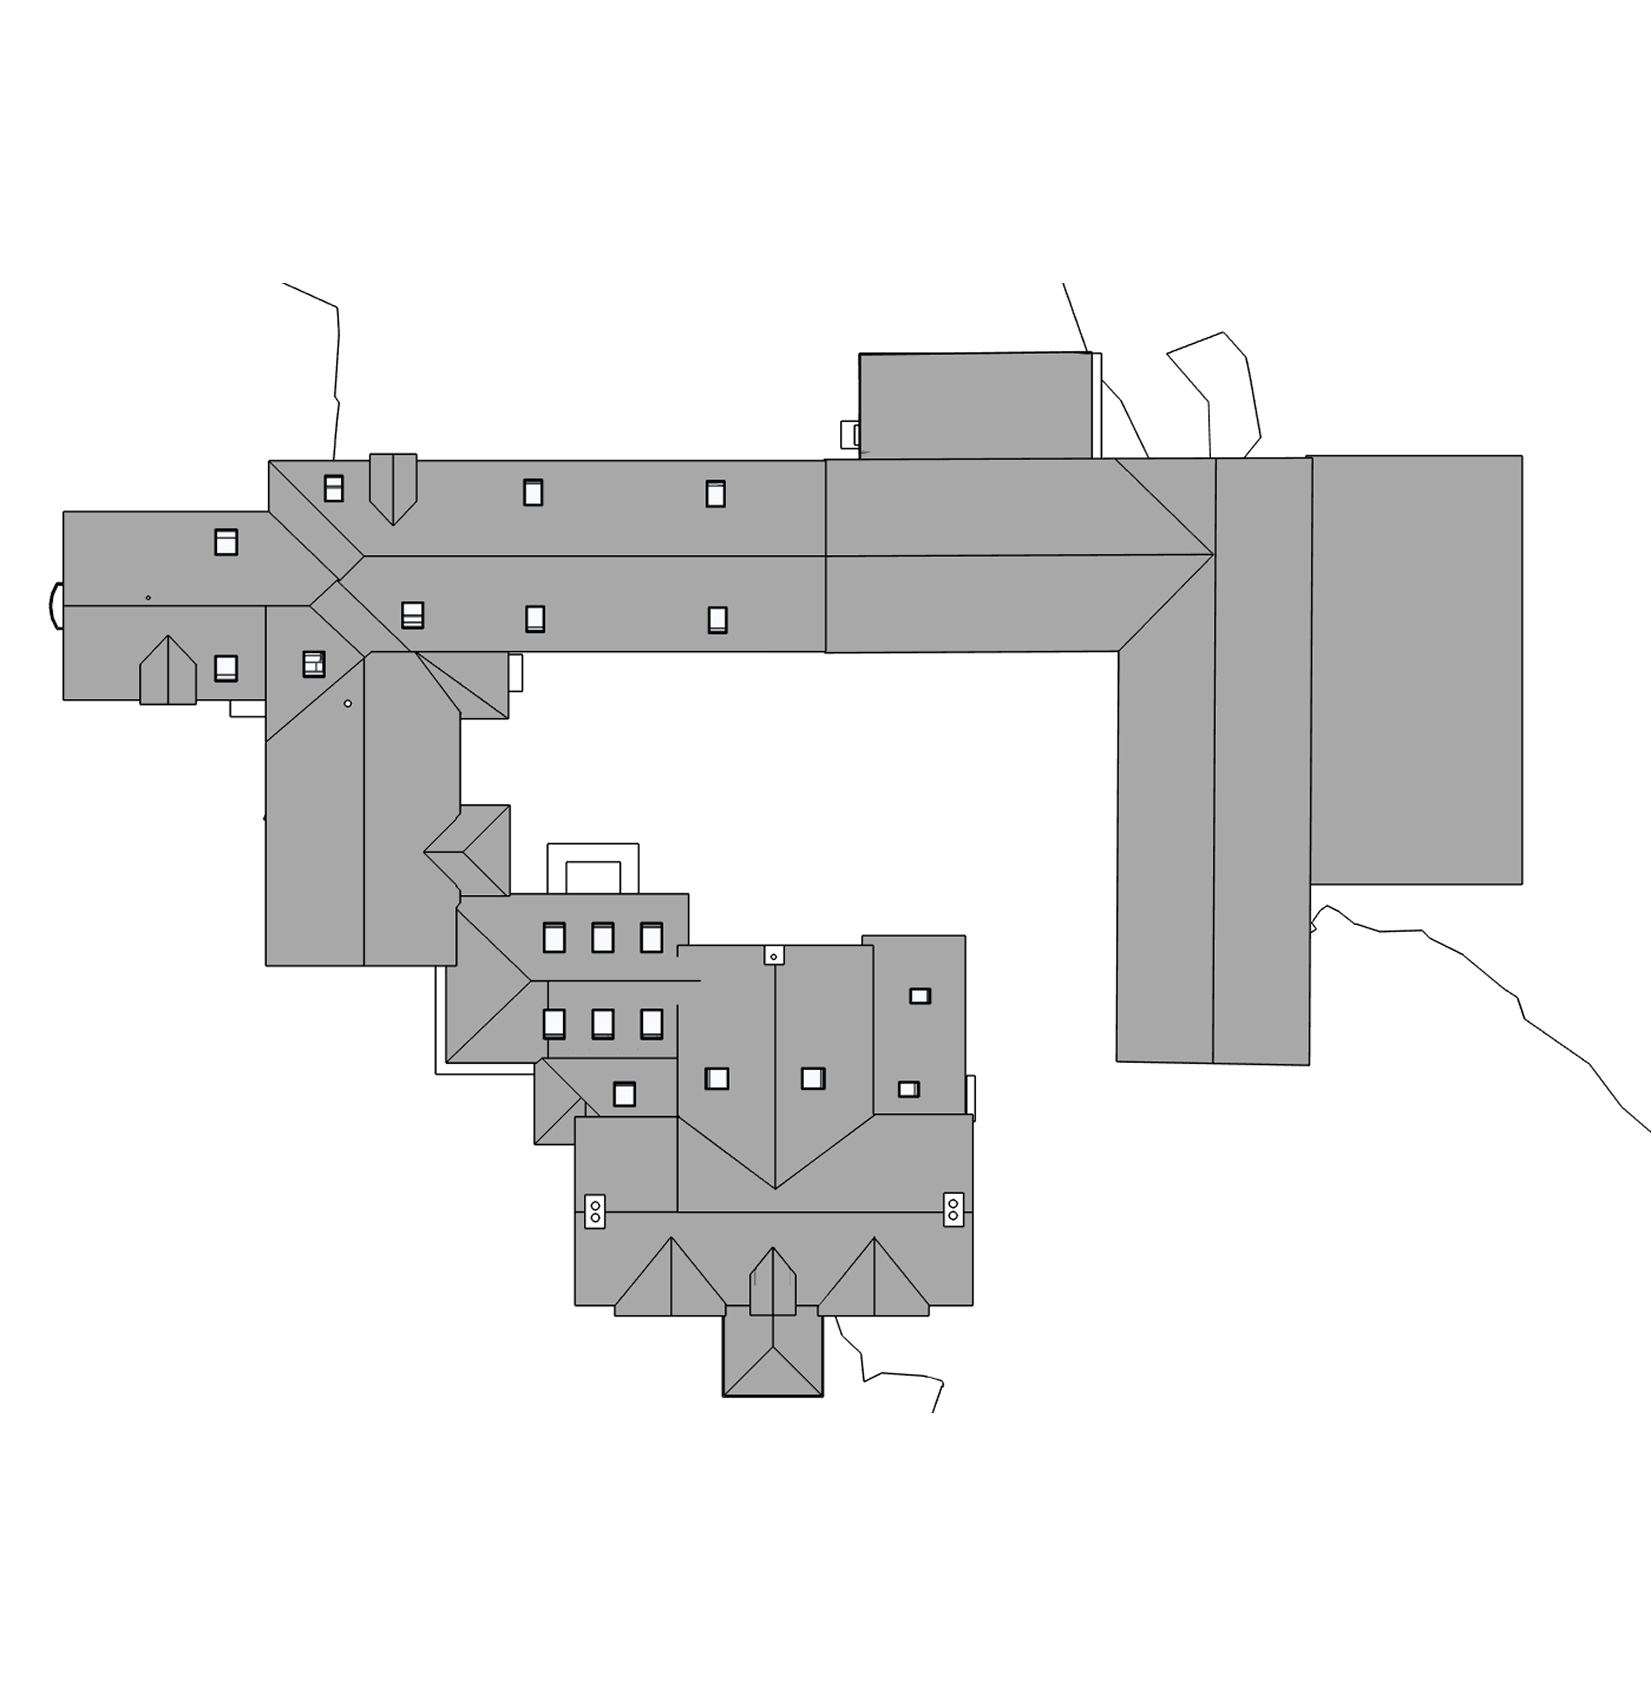
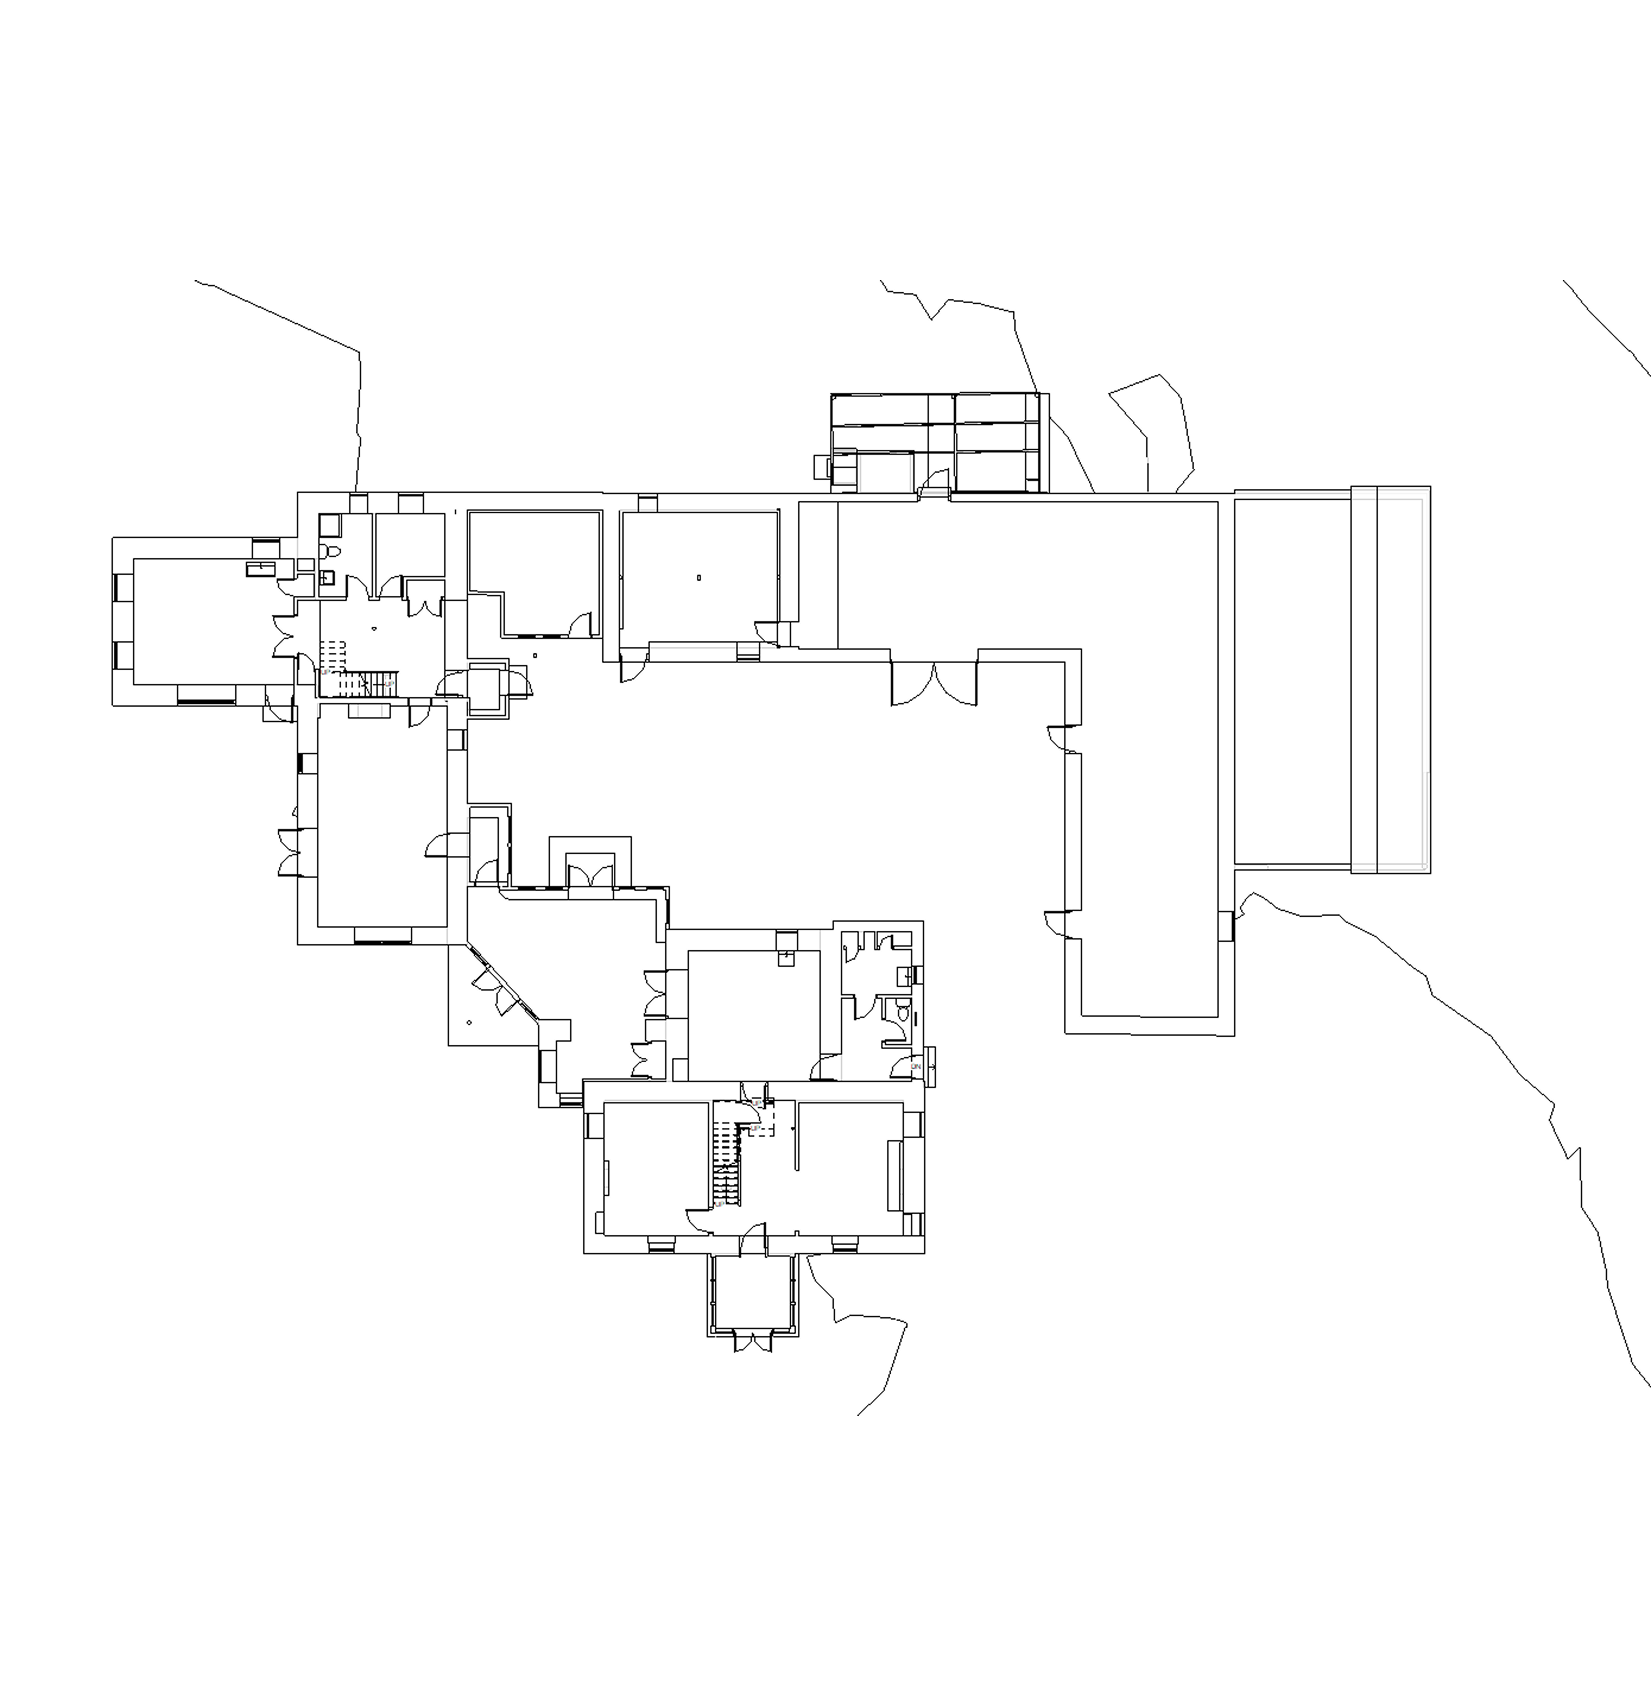
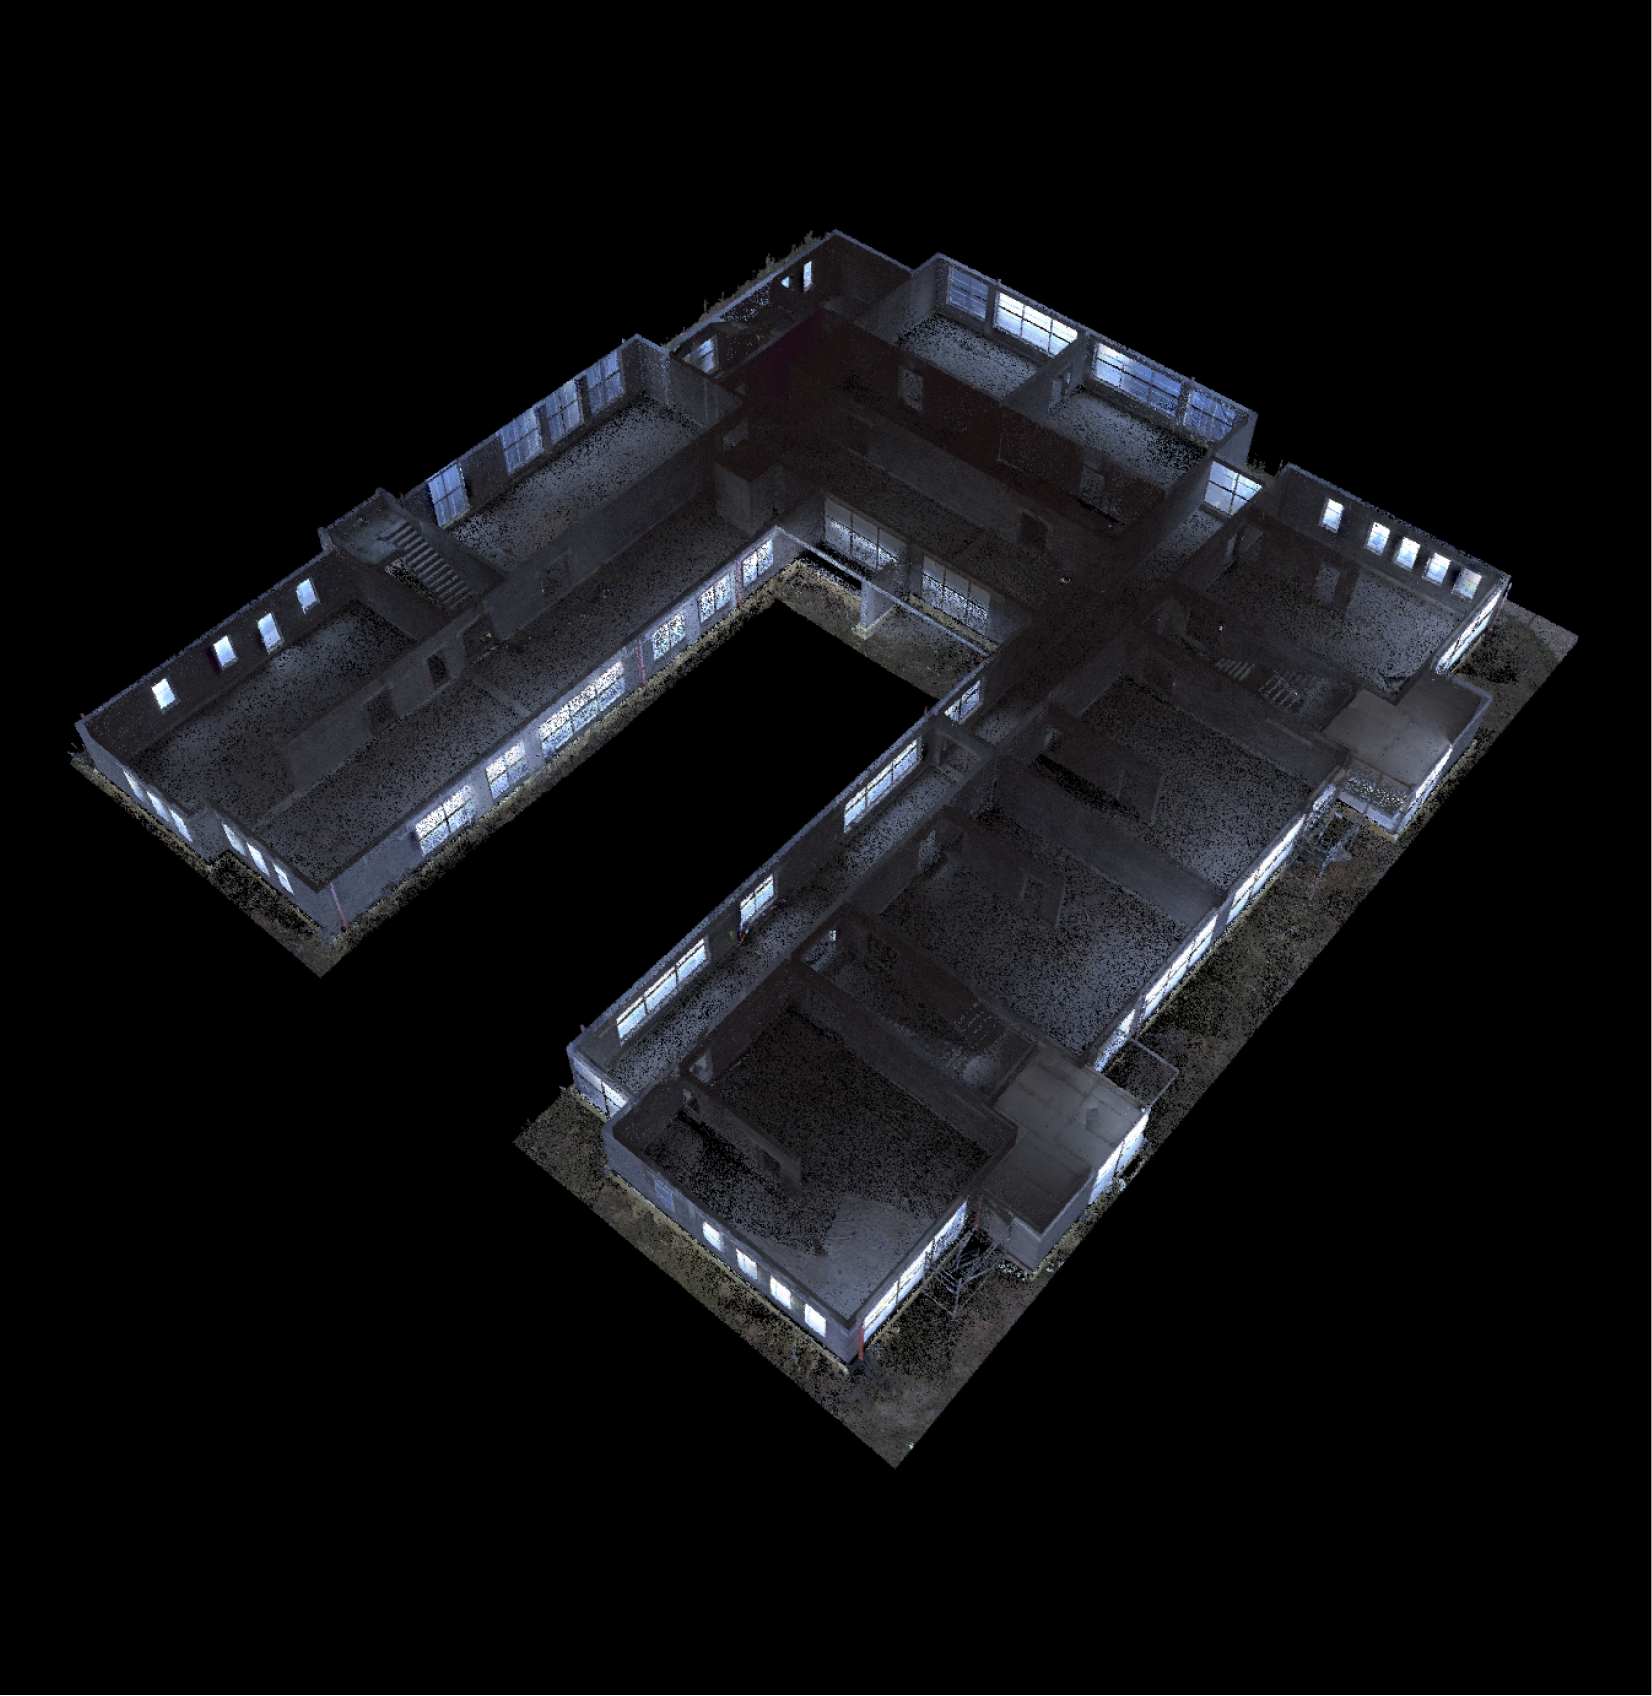
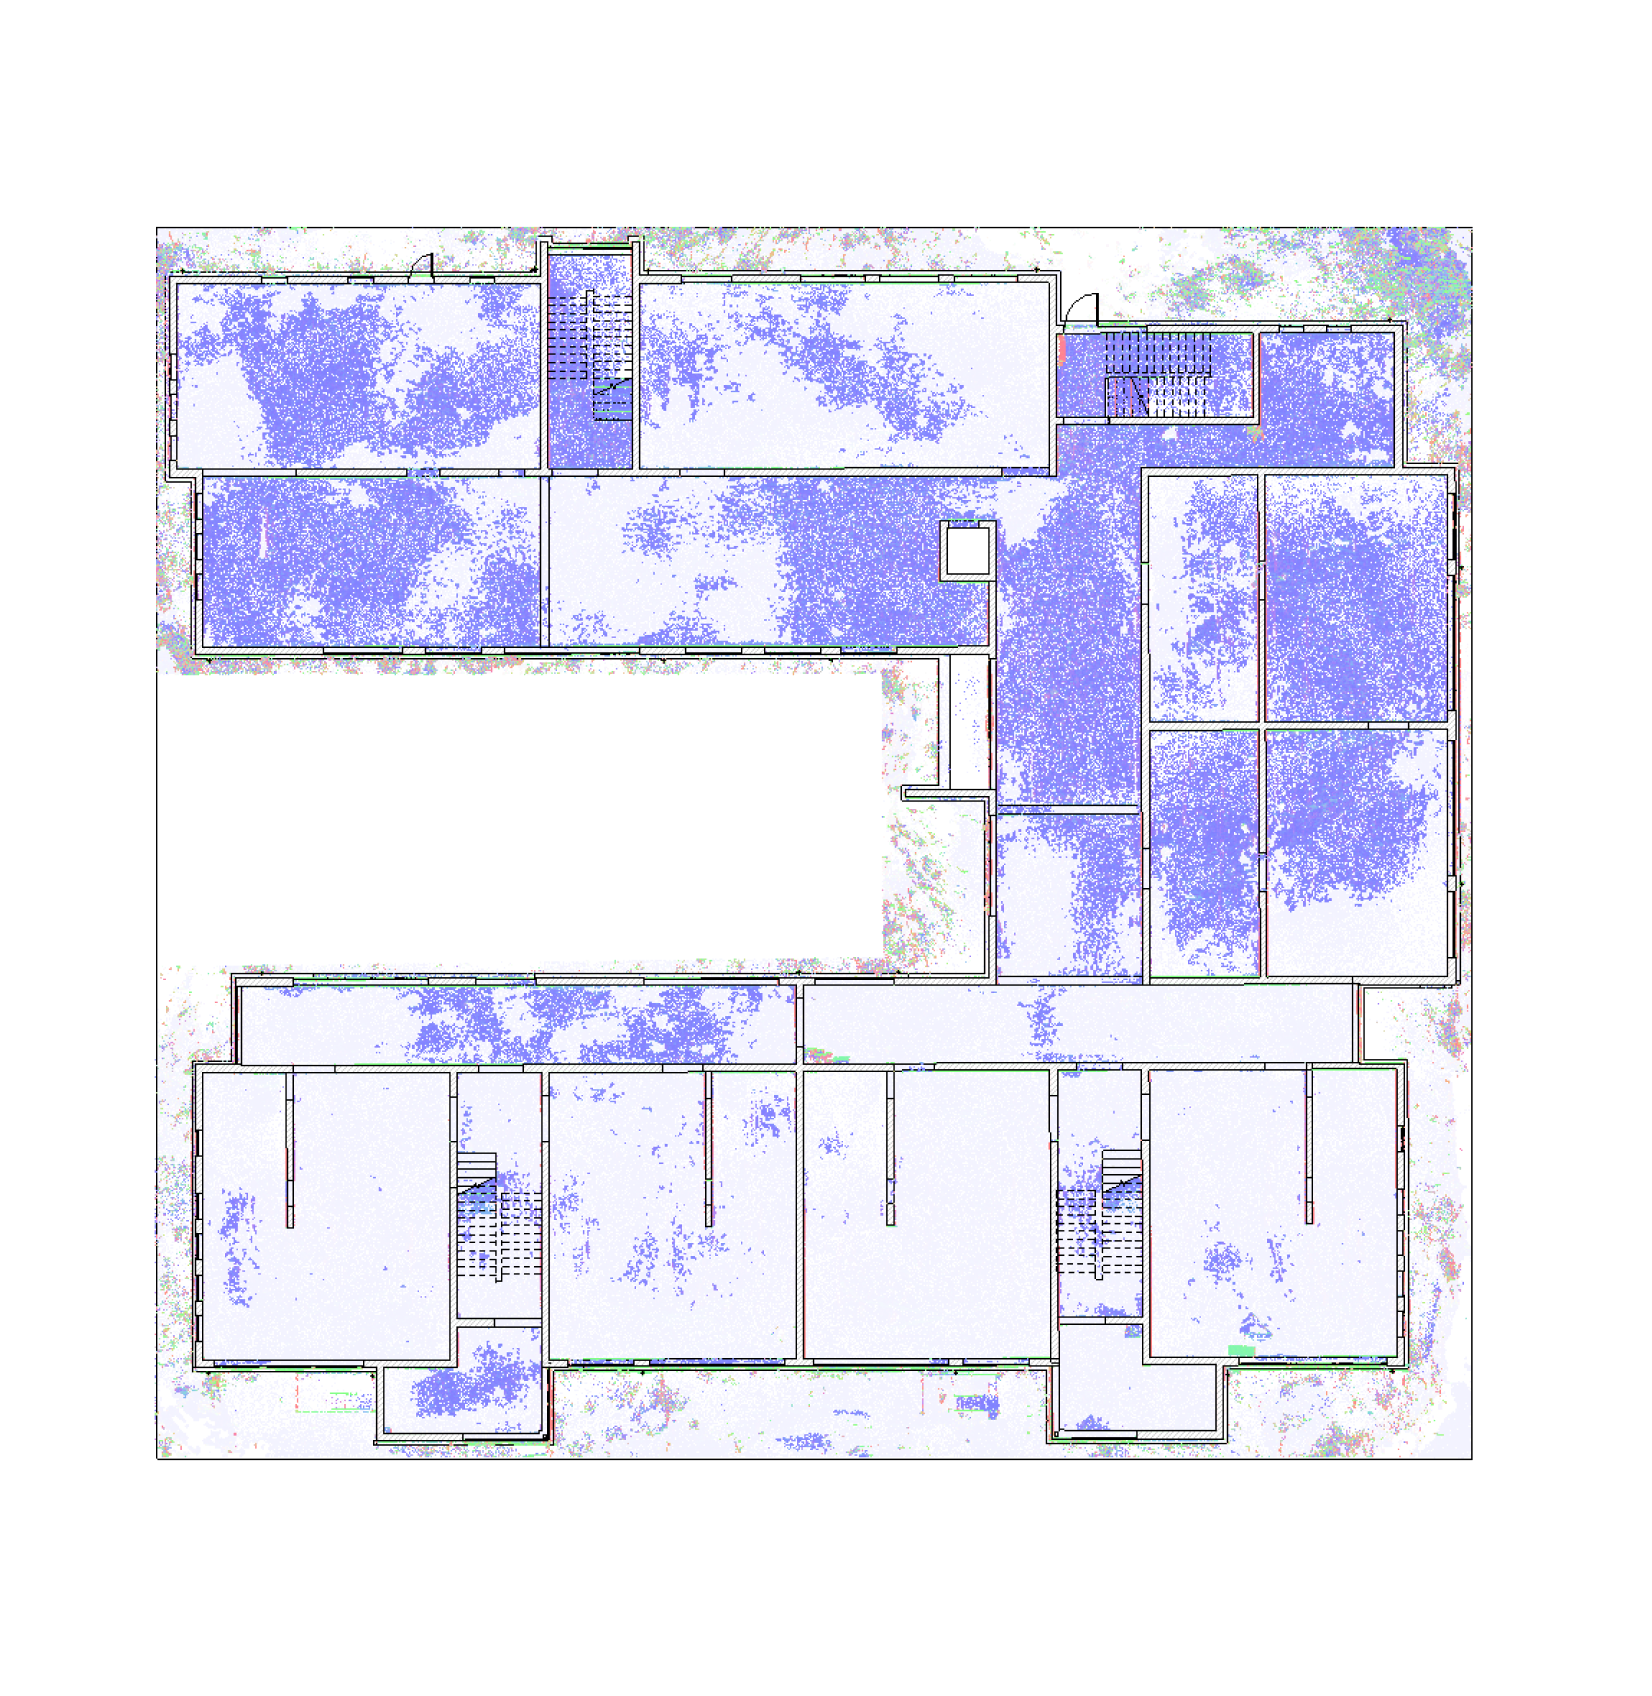
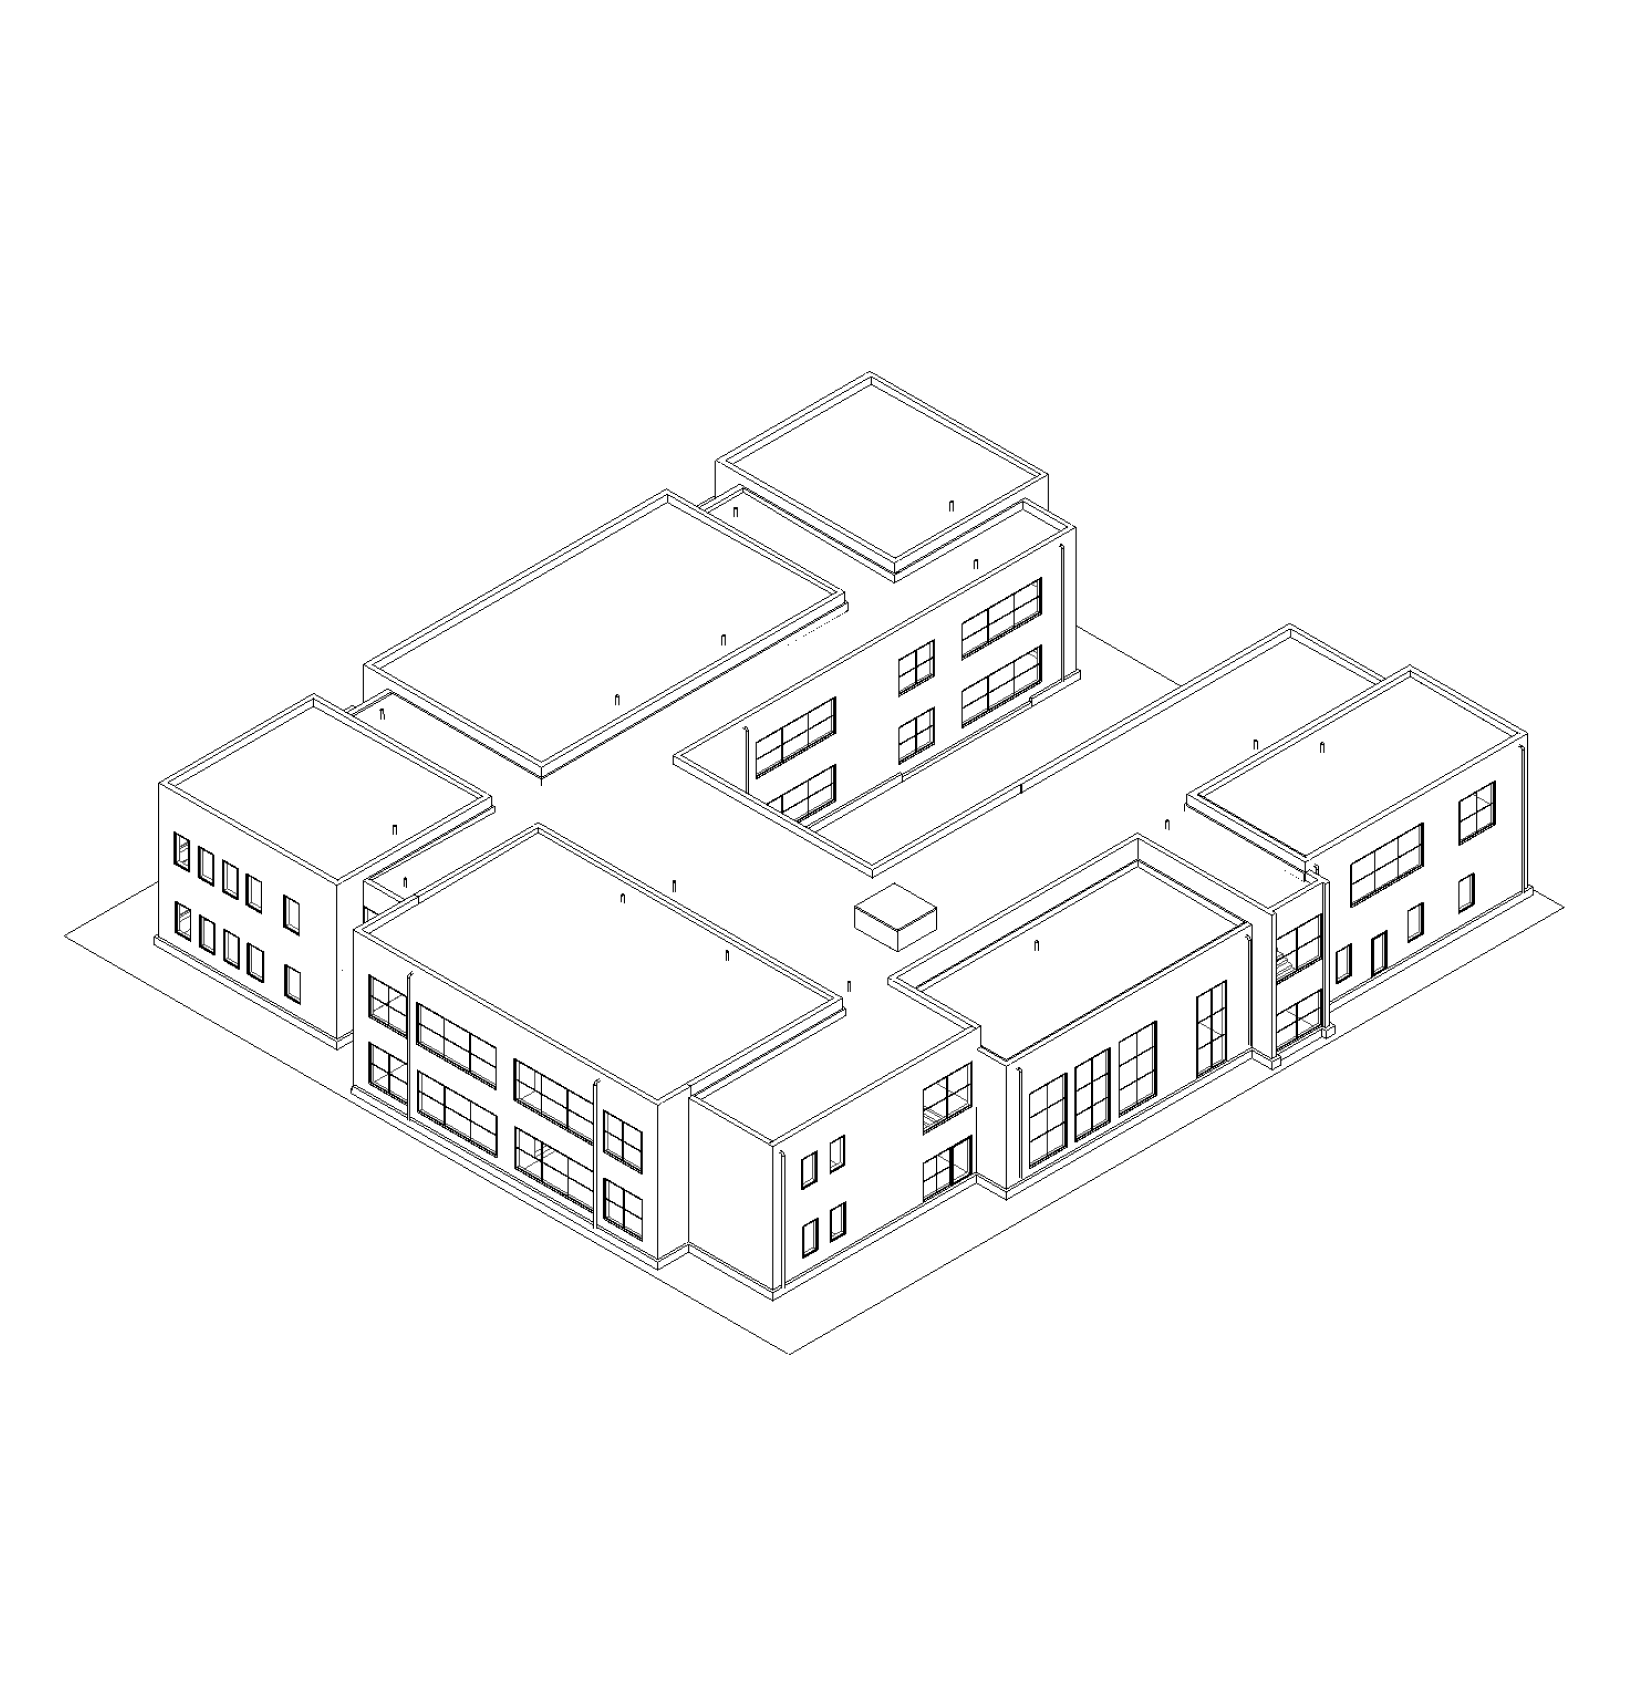
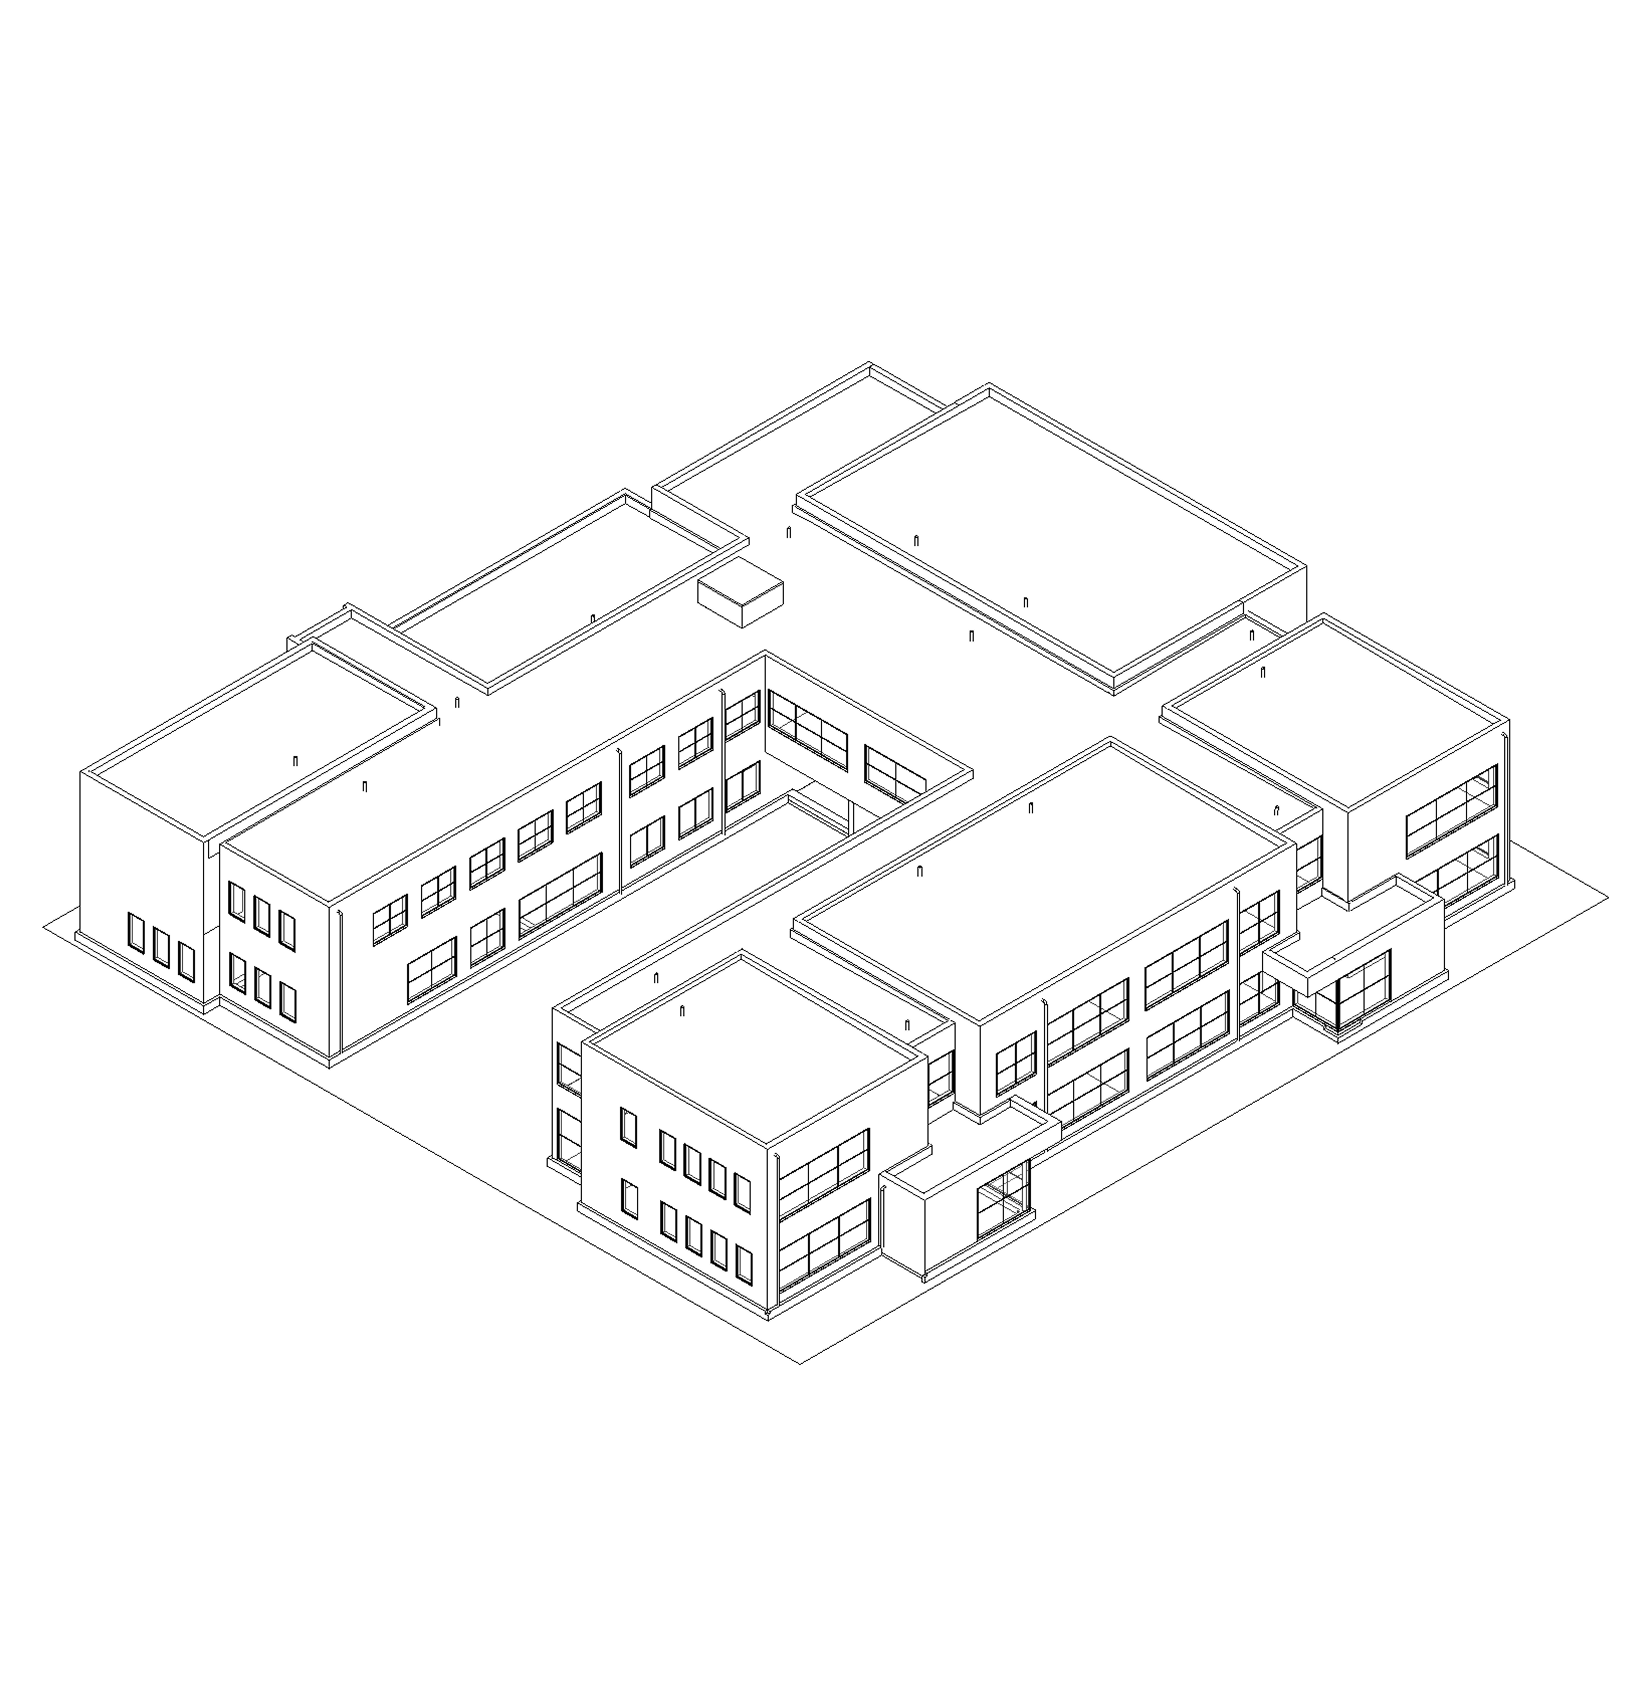
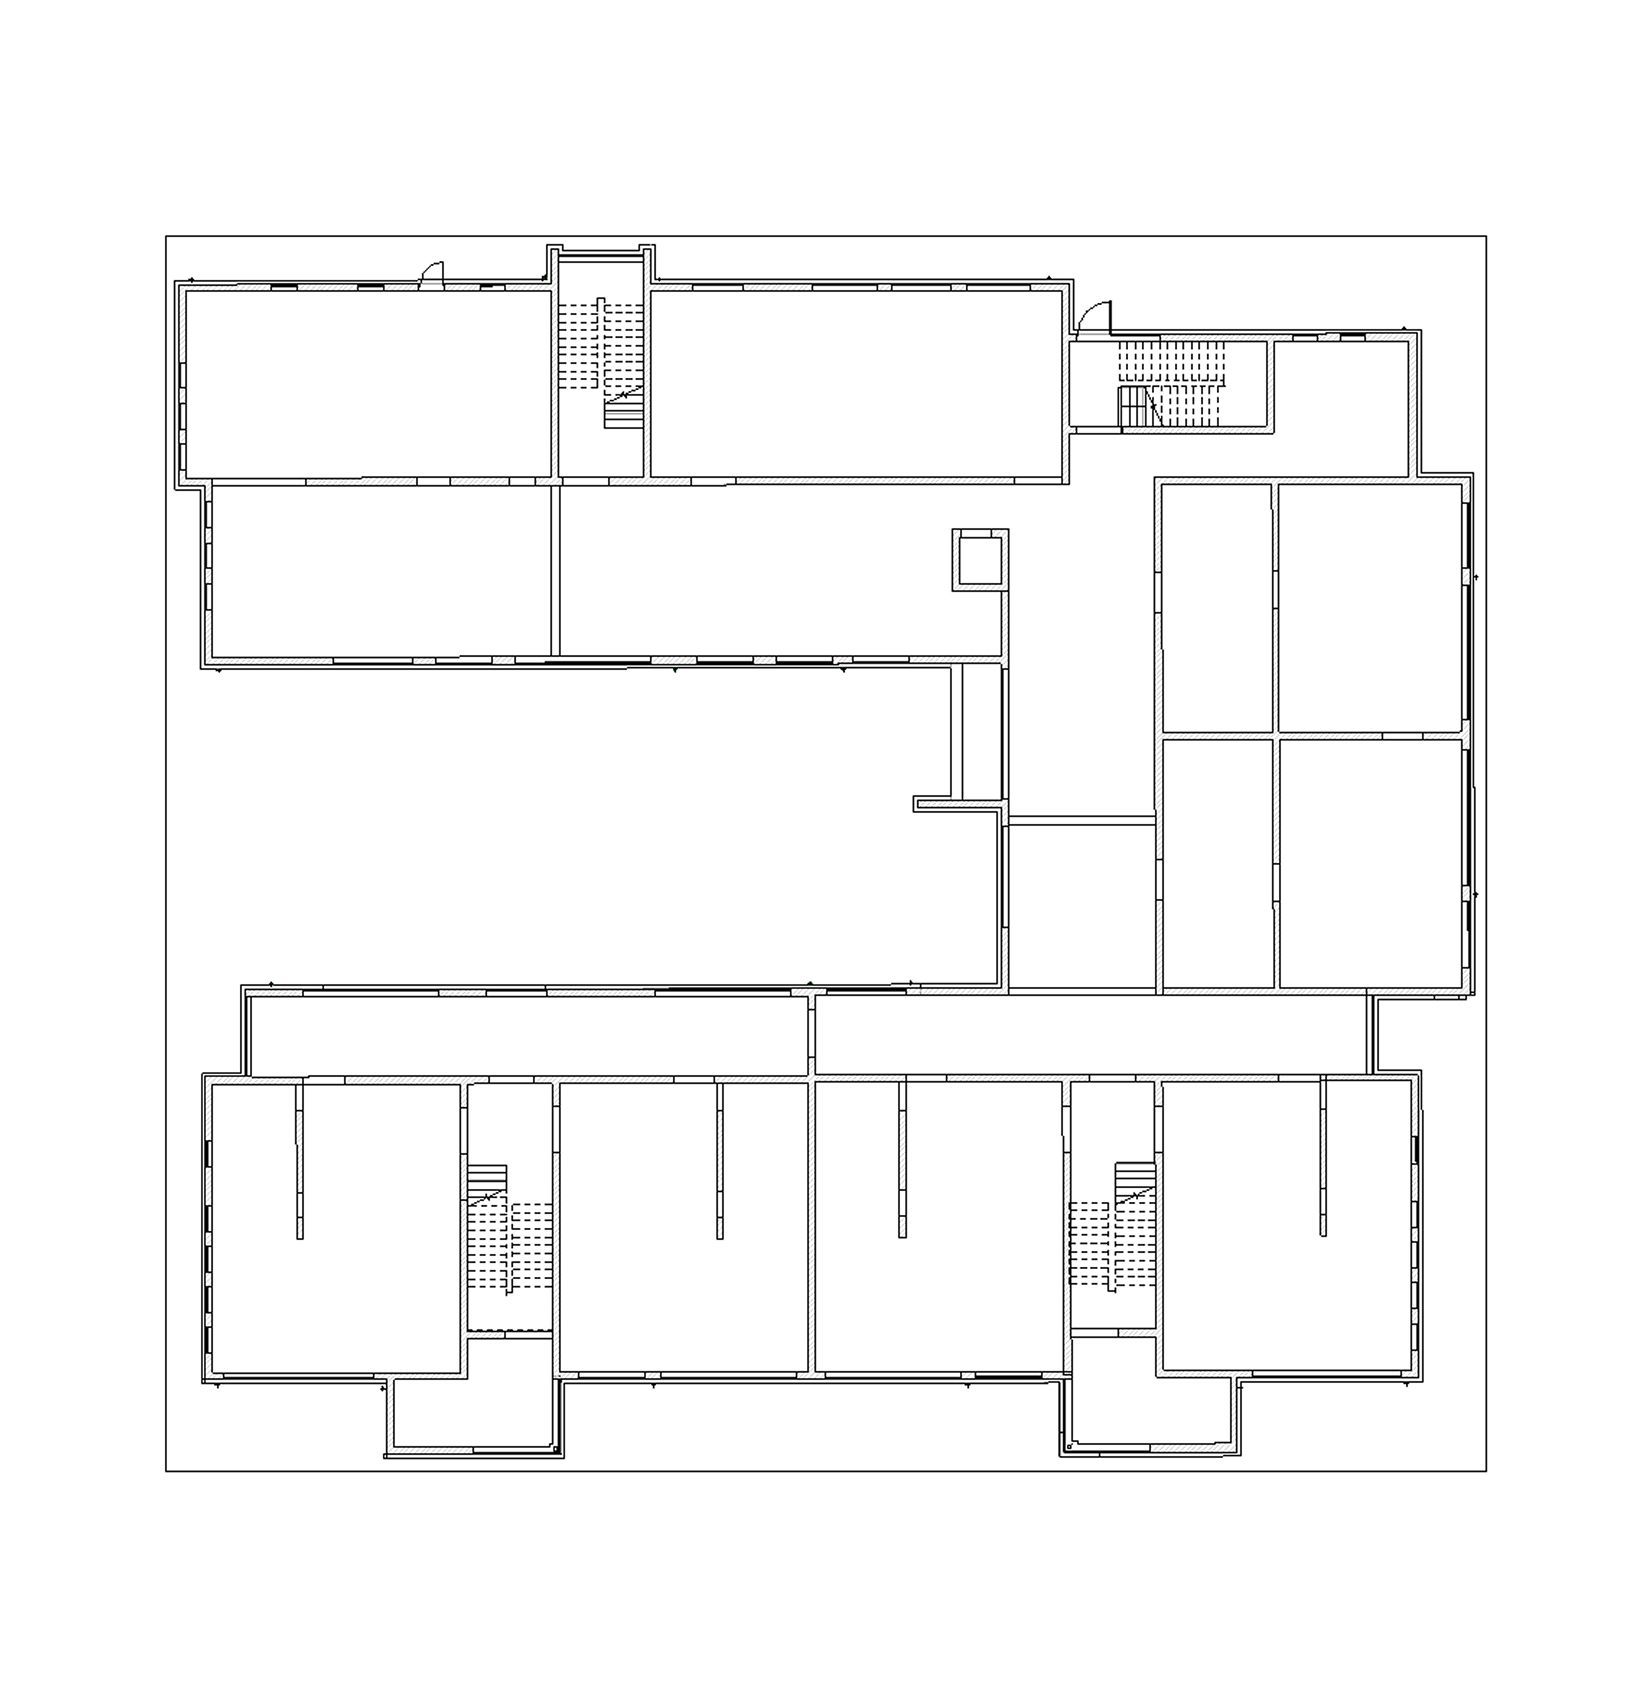
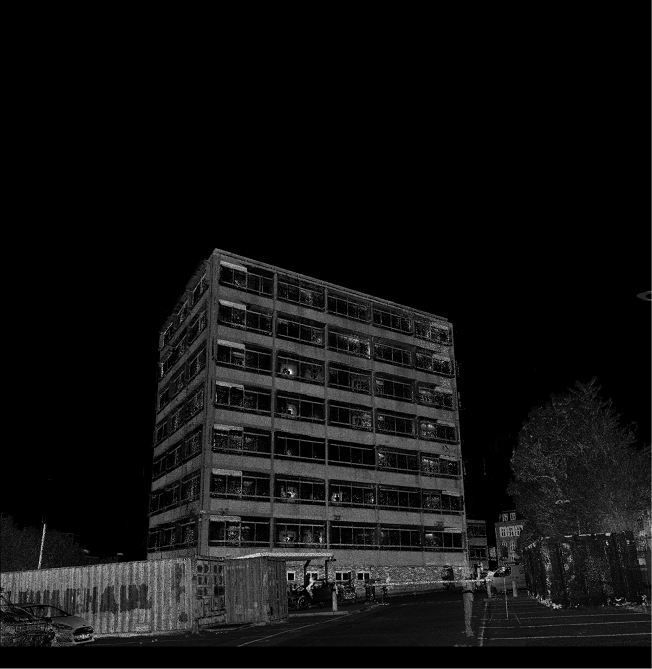
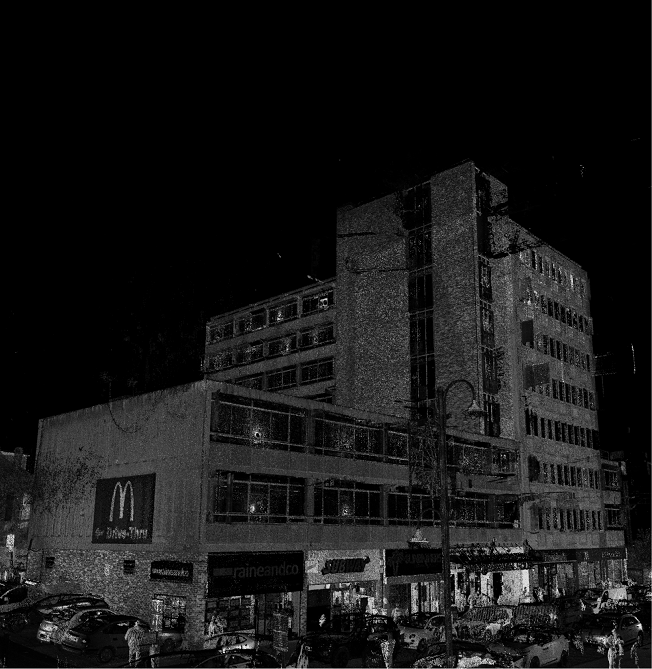
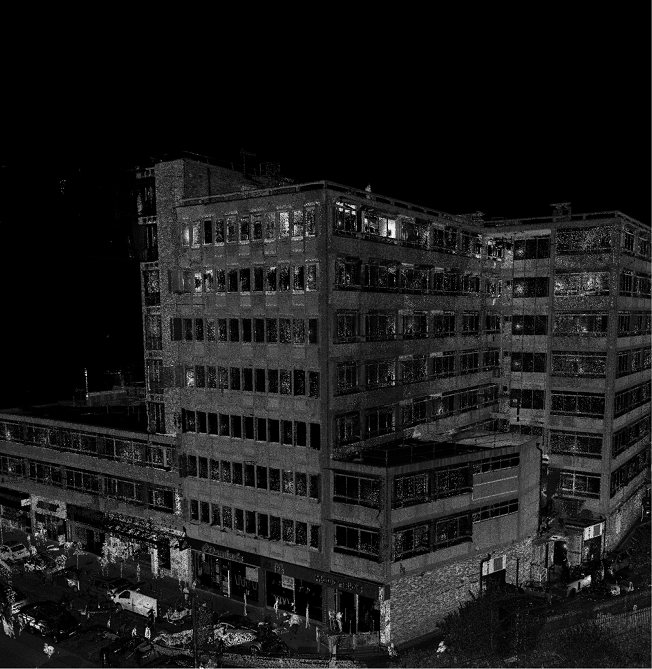
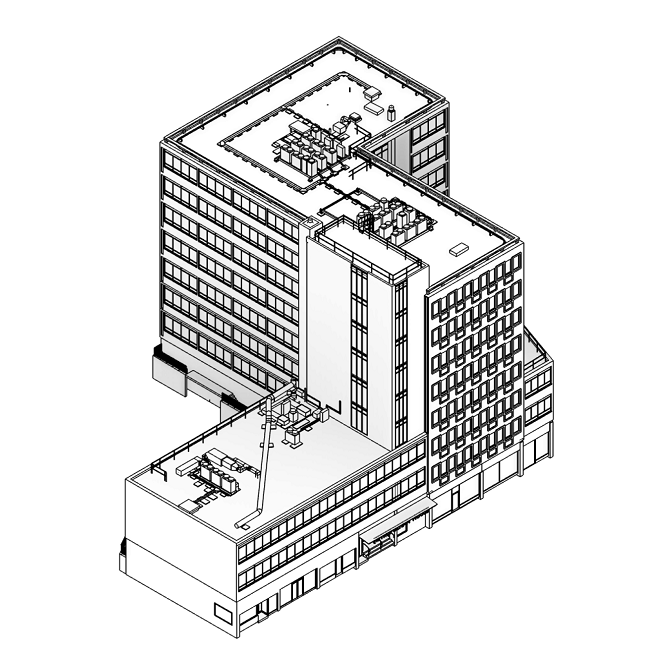
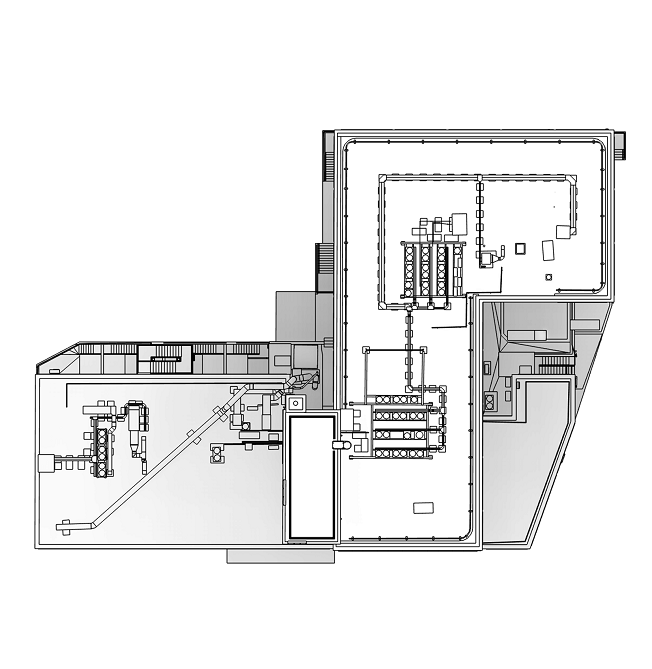
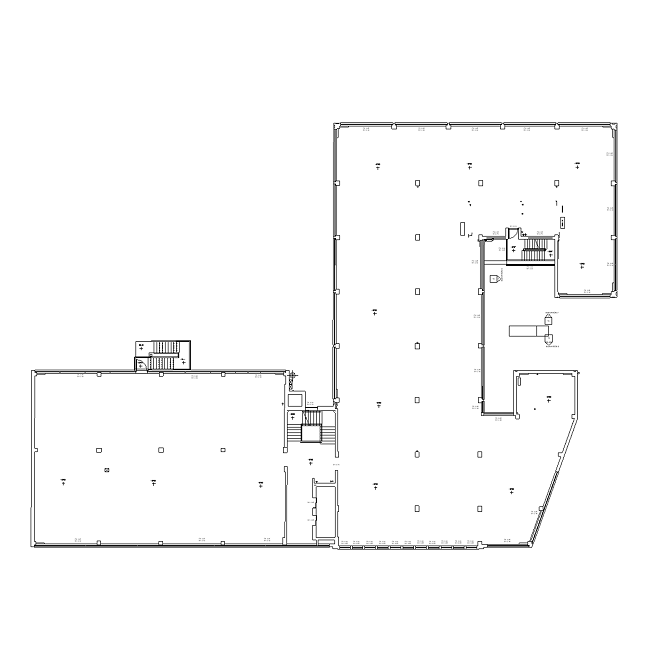
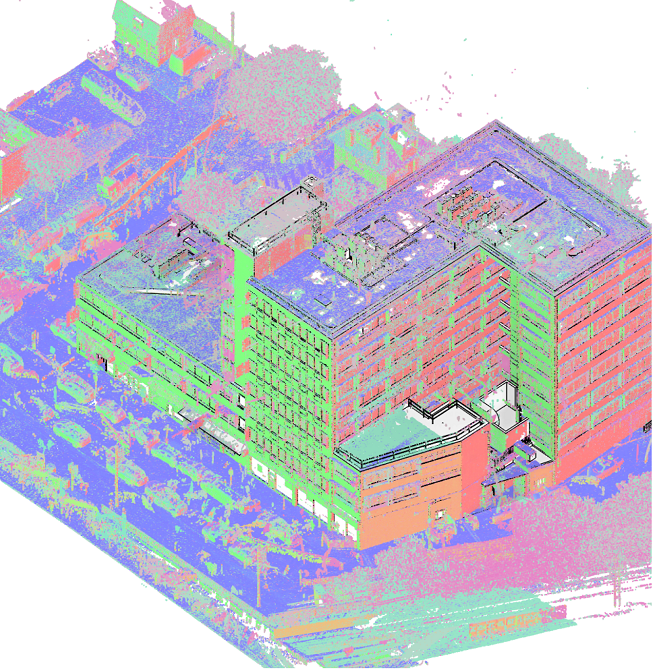
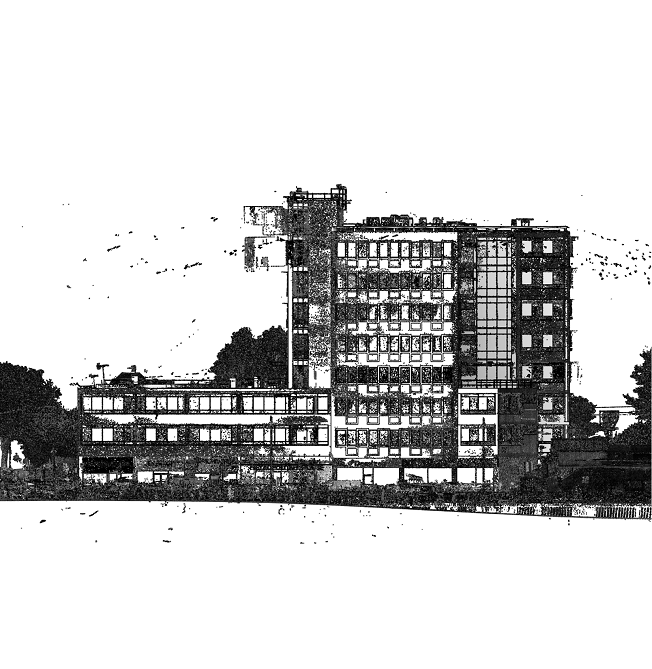
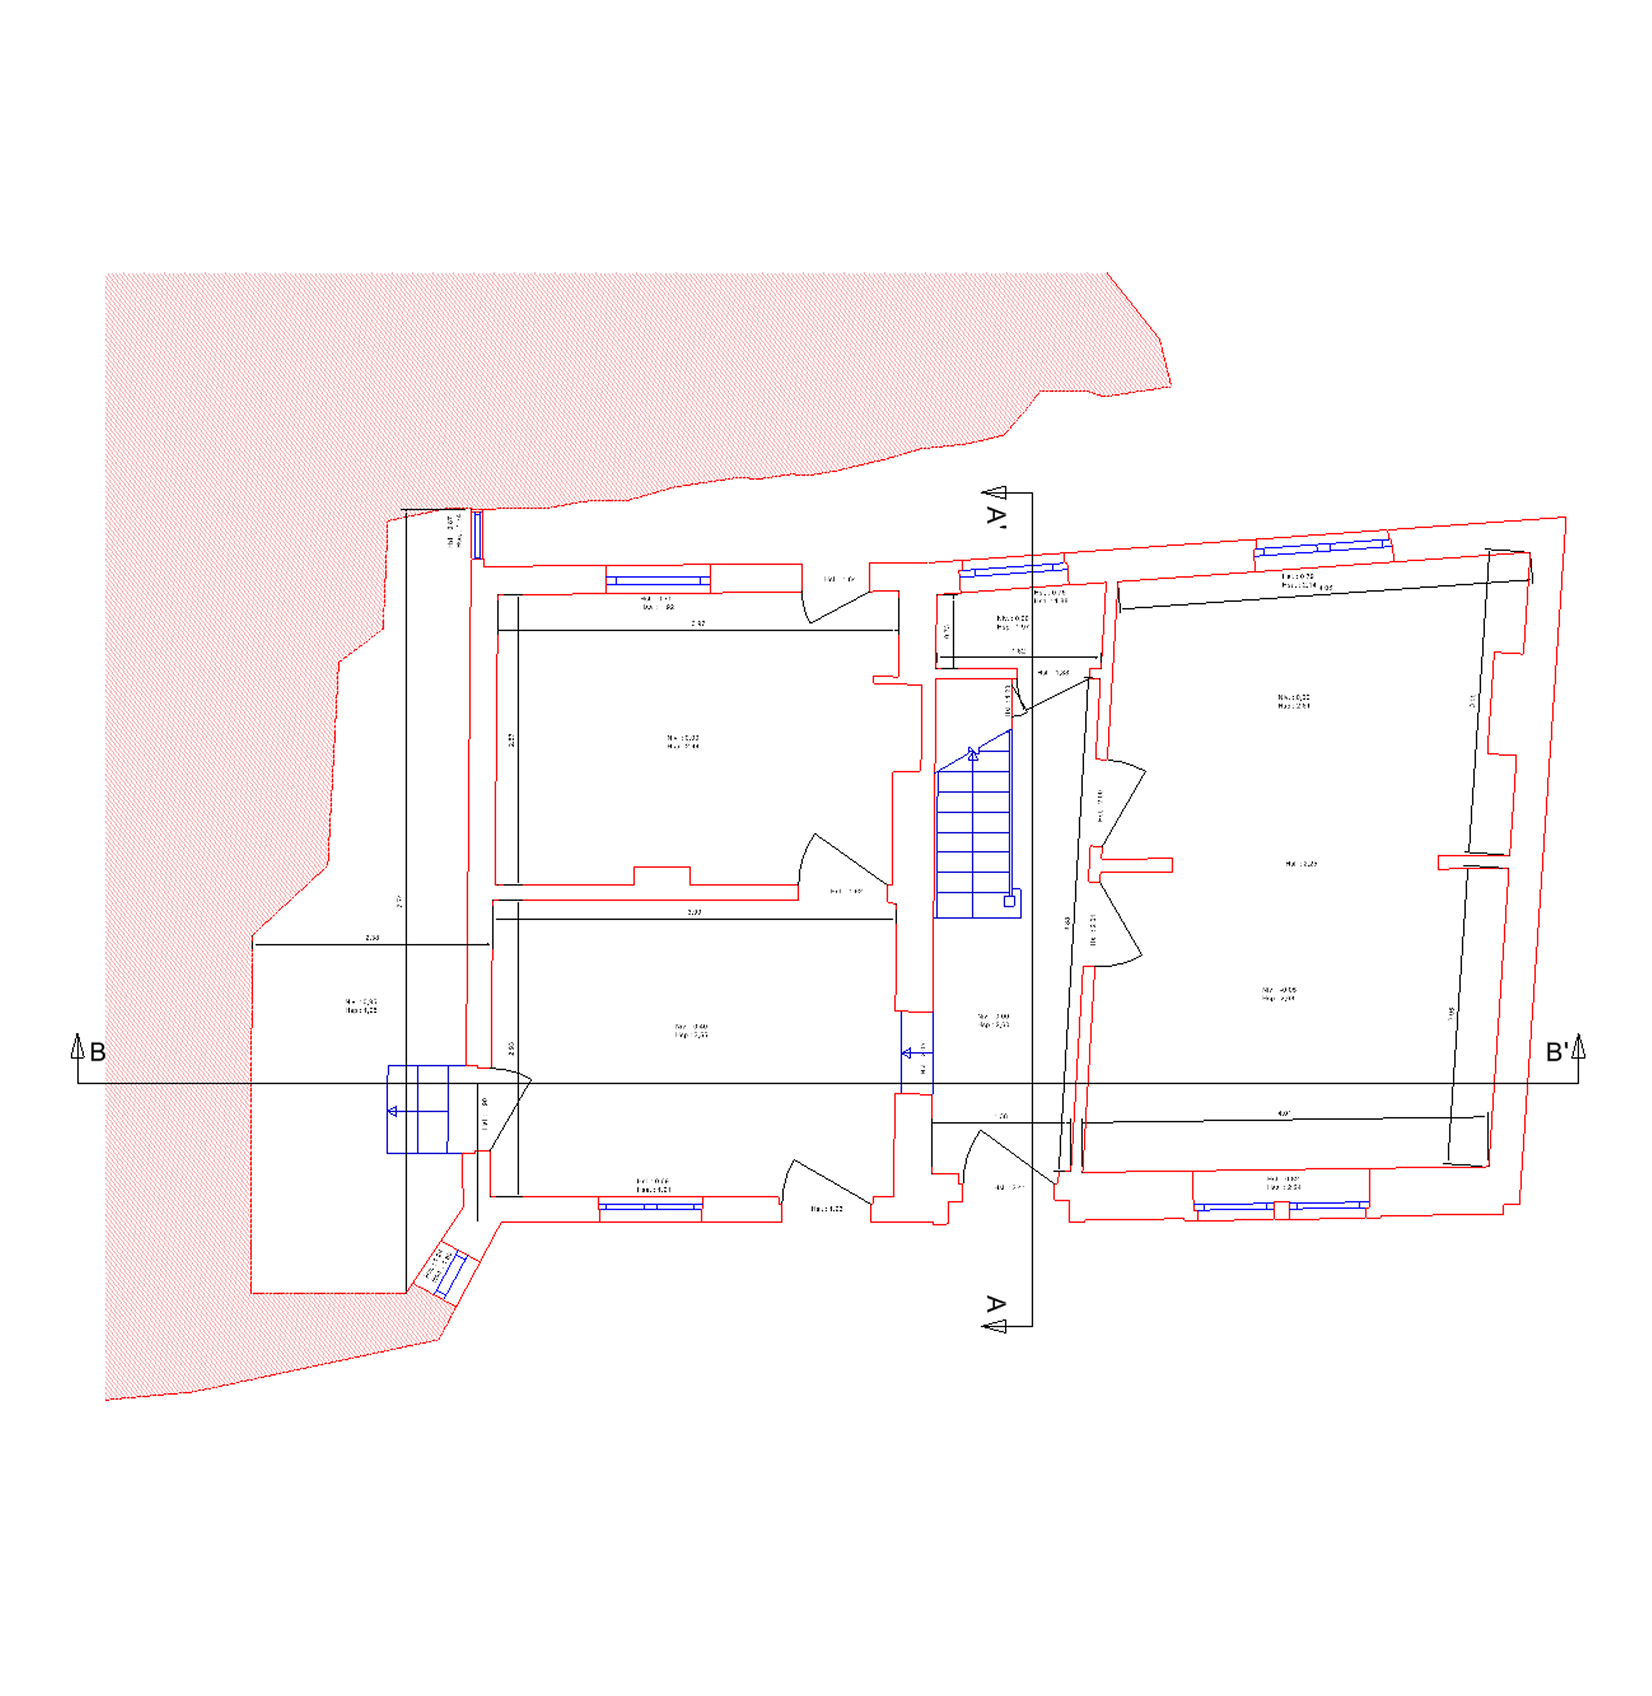
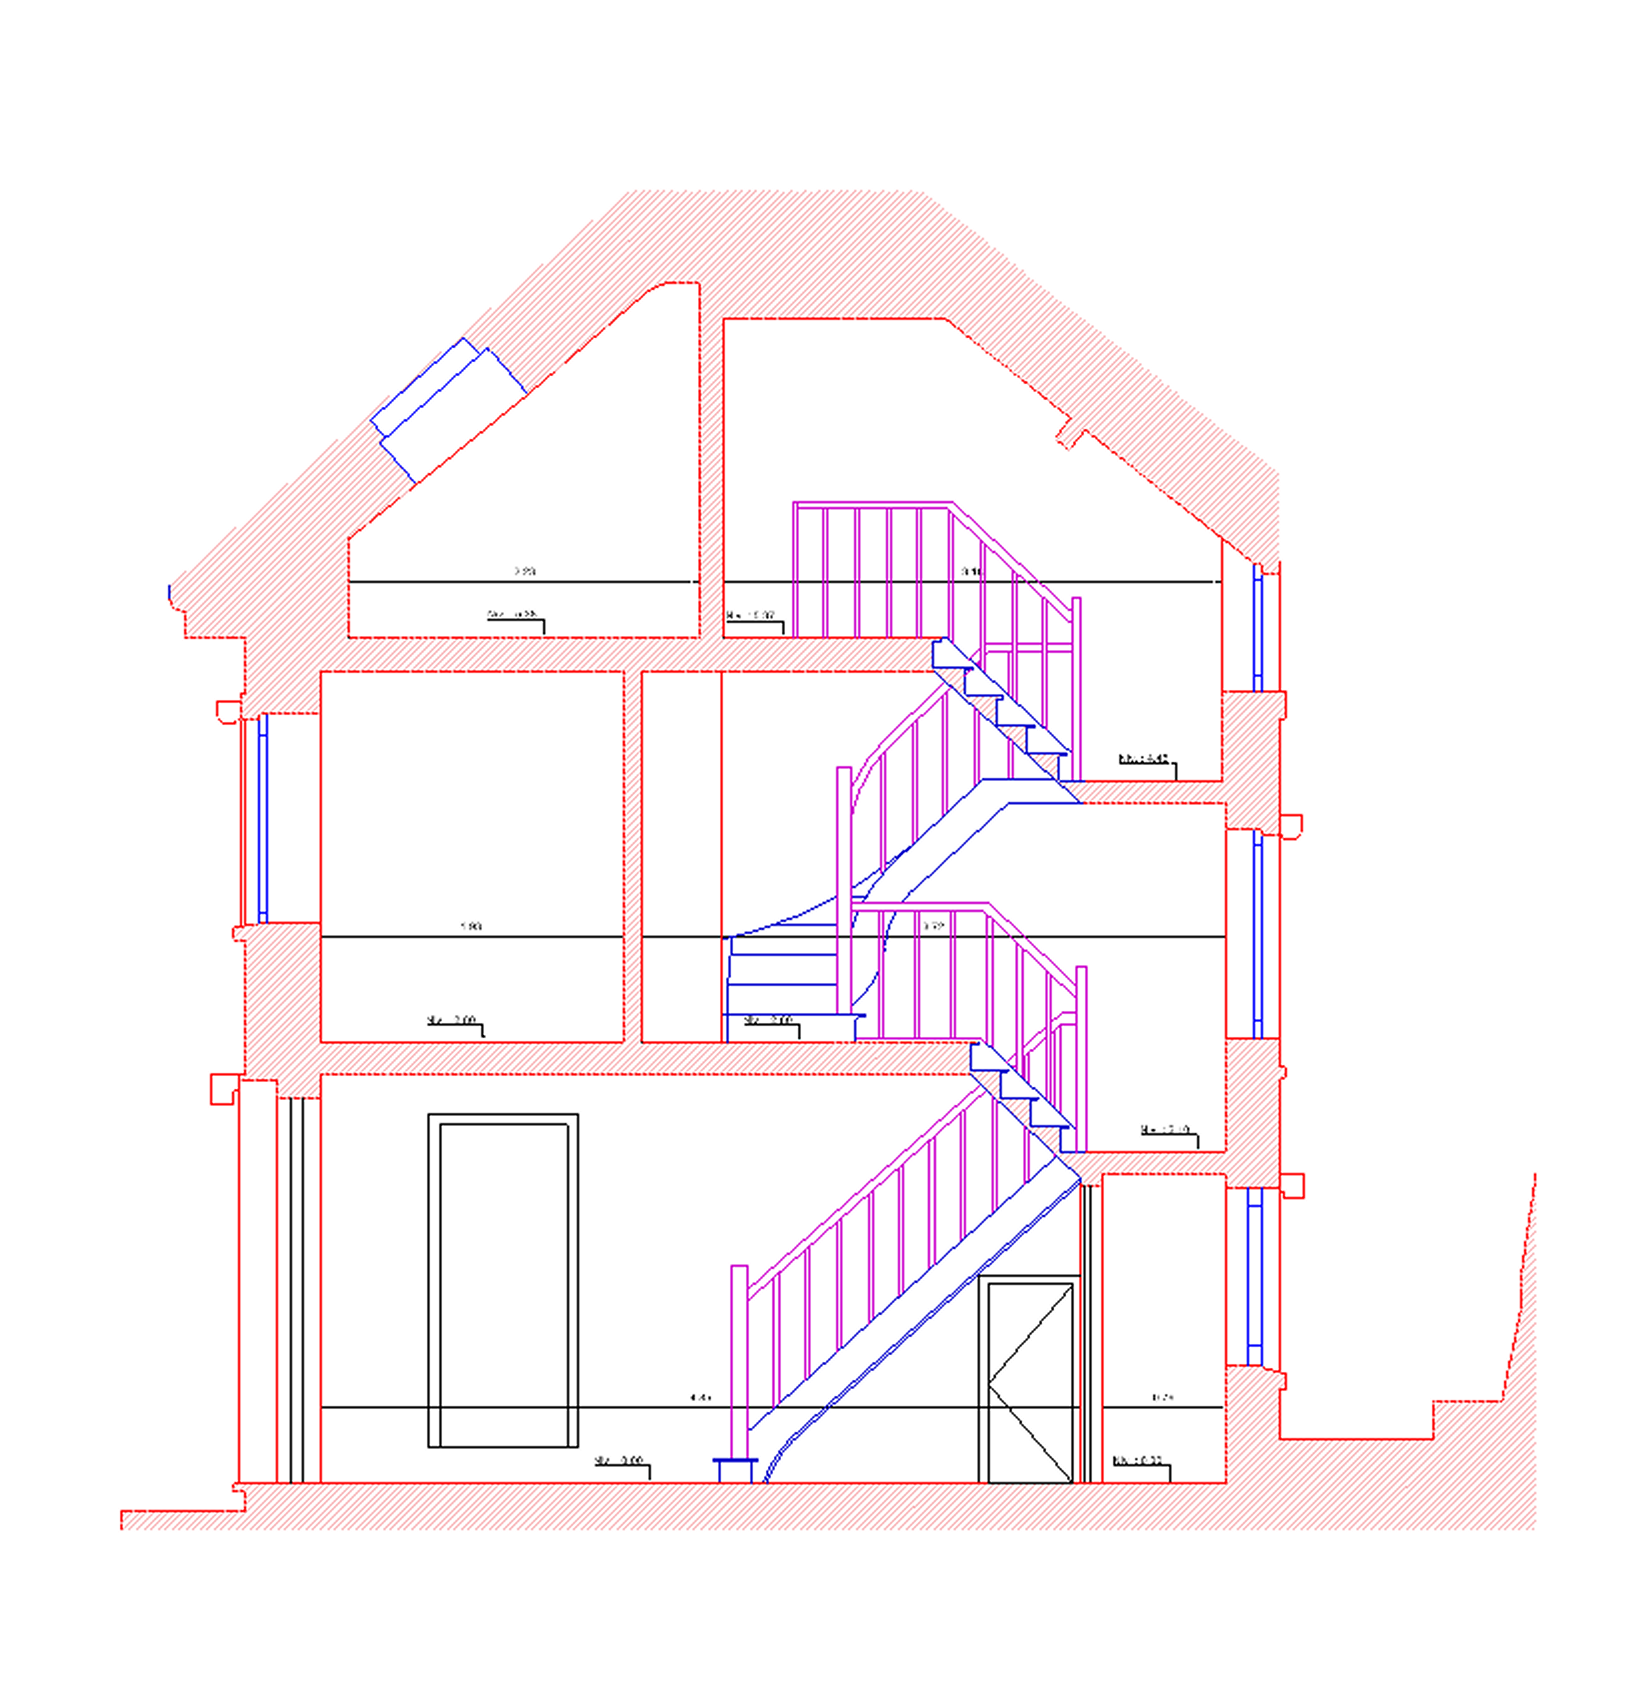
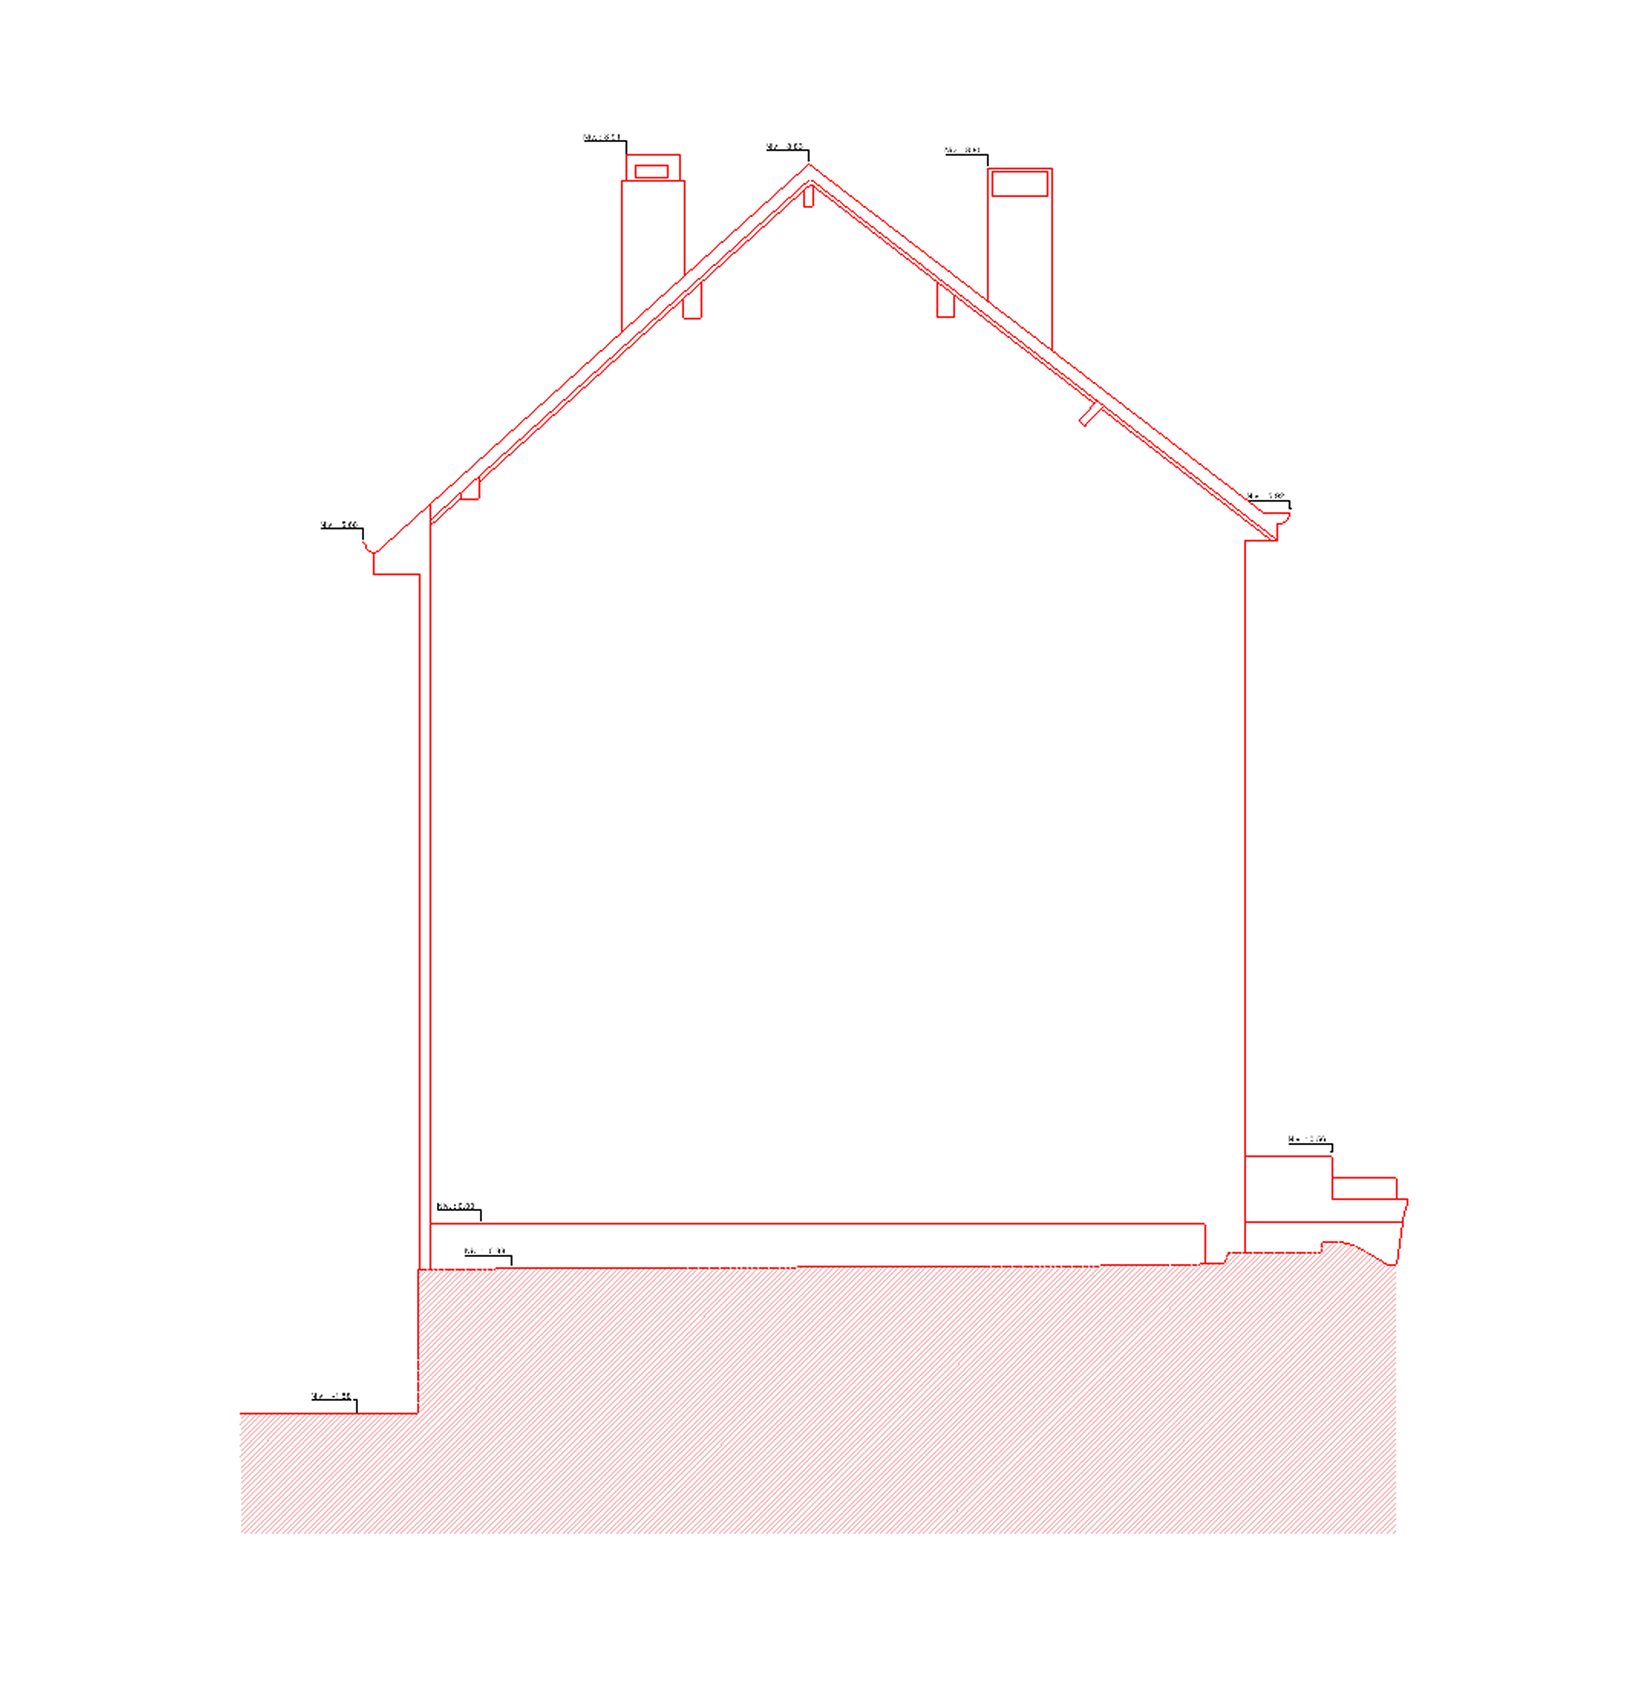
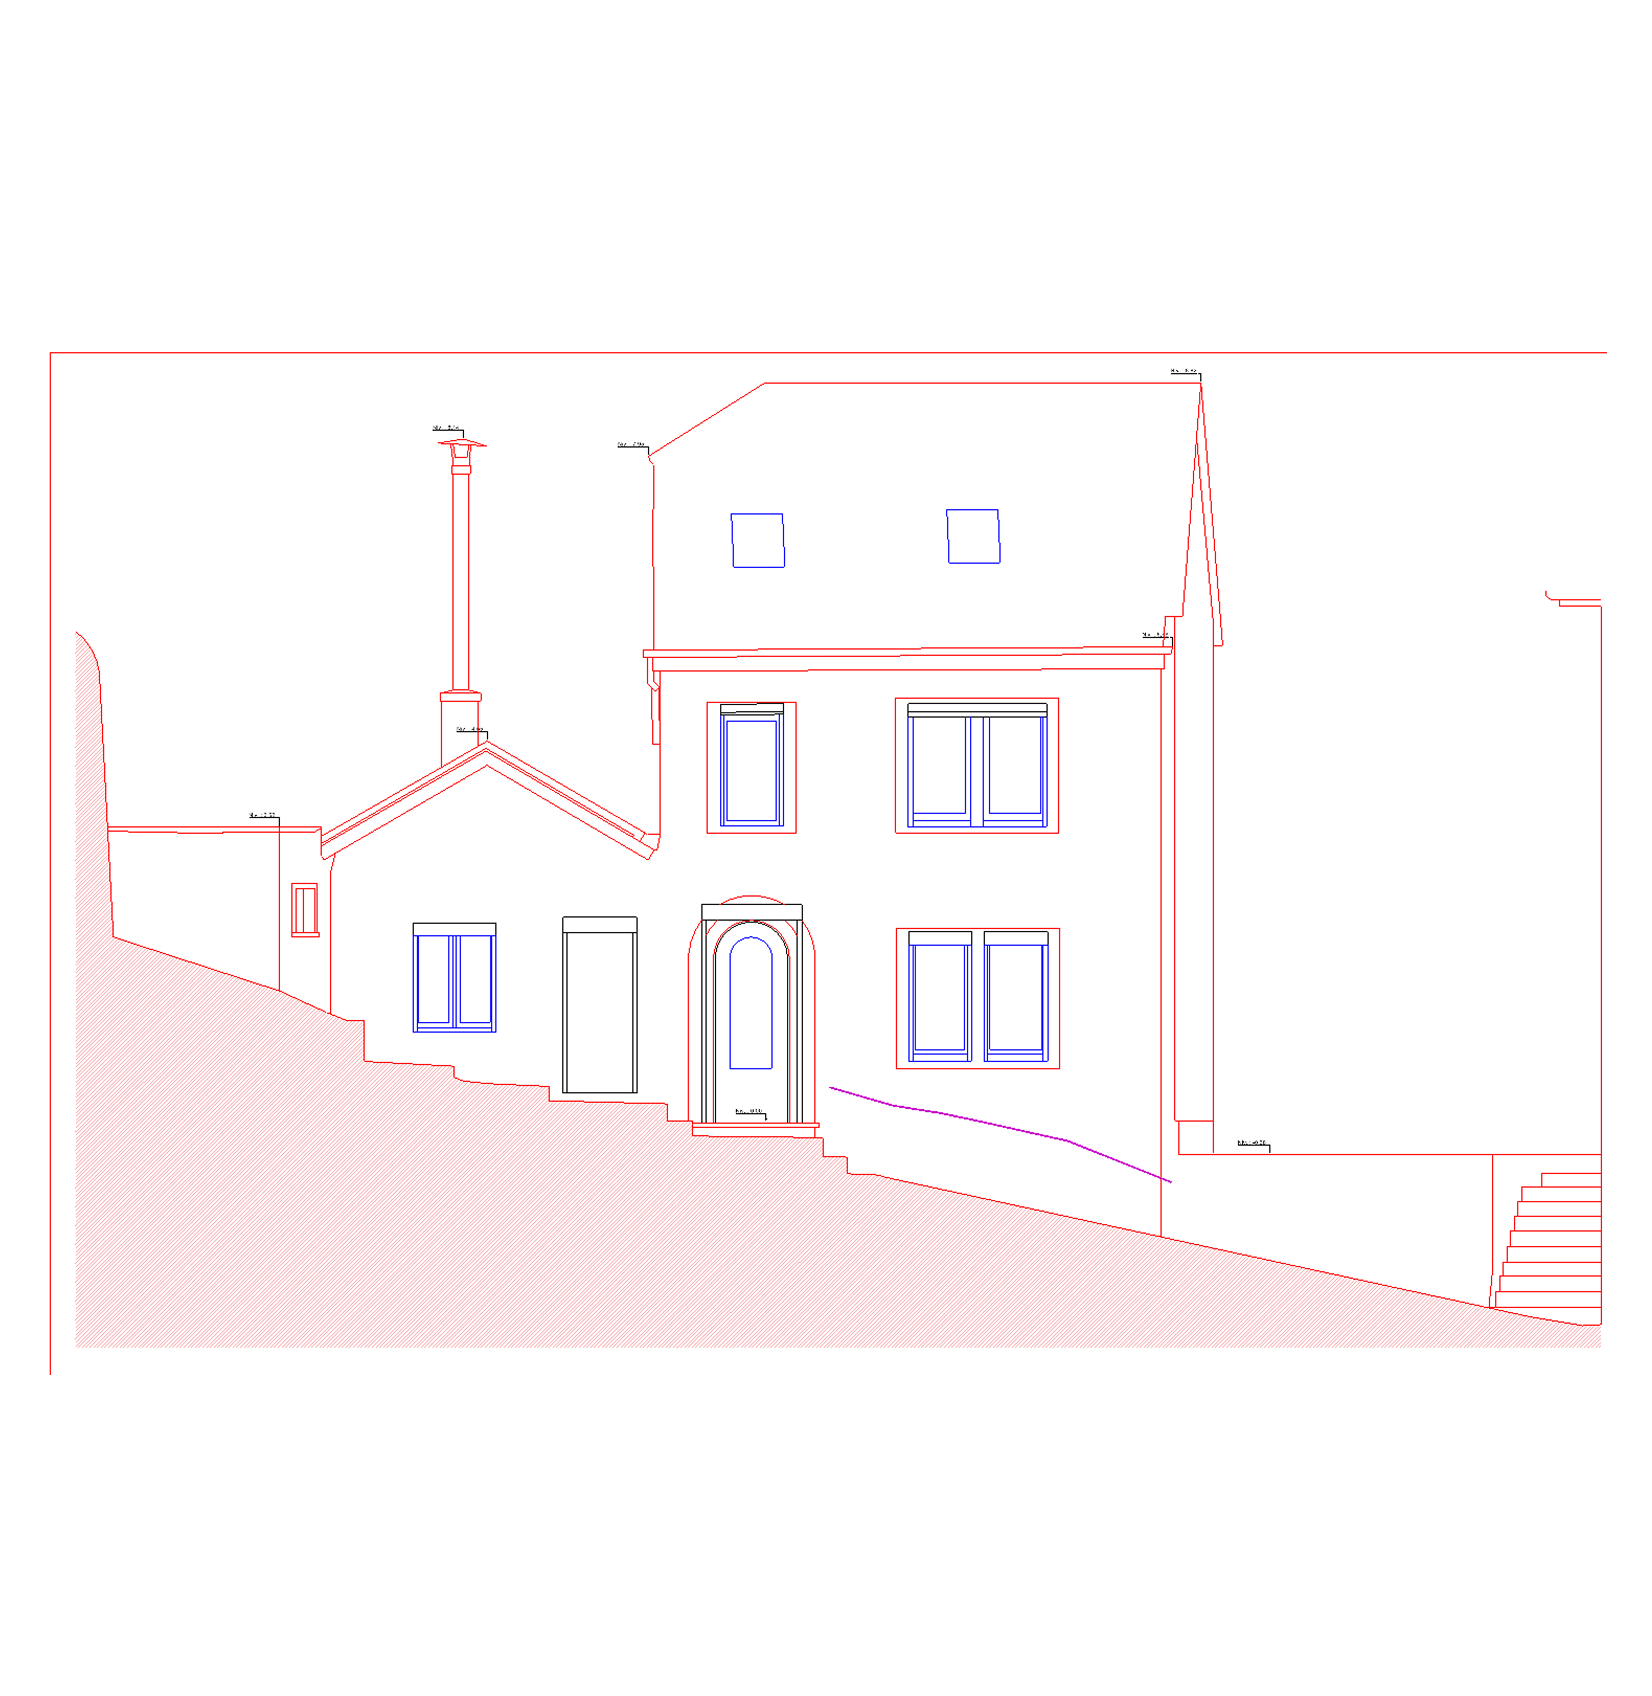
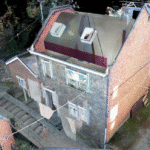
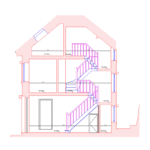
Using the provided point cloud dataset, the team analyzed the existing structure and developed detailed floor plans, building sections, and façade drawings reflecting the current condition of the property.
The project focused on transforming complex survey data into clear and structured documentation to support further architectural and engineering work
Client: The company delivers advanced industrial design, CAD modeling, and geodetic survey services, using 3D scanning and digital modeling to support engineering projects.
Sector: Construction
Sub Sector: Private Construction
Services: Scan to CAD
Solution:
Processing and analysis of point cloud survey data
Creation of accurate floor plans, sections, and façade drawings
Preparation of structured architectural documentation for the project
Location: La Roche-en-Ardenne, Belgium
People:
GIS-Point assembled a team of experienced BIM specialists and CAD technicians to process the point cloud data and develop the required architectural drawings.
The team carefully analyzed the survey dataset and collaborated closely to ensure accuracy and consistency throughout the documentation process.
As a result, precise floor plans, sections, and façade drawings were successfully delivered in accordance with the project requirements.
Technology and Software:
The project utilized Autodesk ReCap and AutoCAD for point cloud processing and preparation of architectural documentation. Internal cloud storage was used for secure data management and team collaboration.
Process & Challenges
Process:
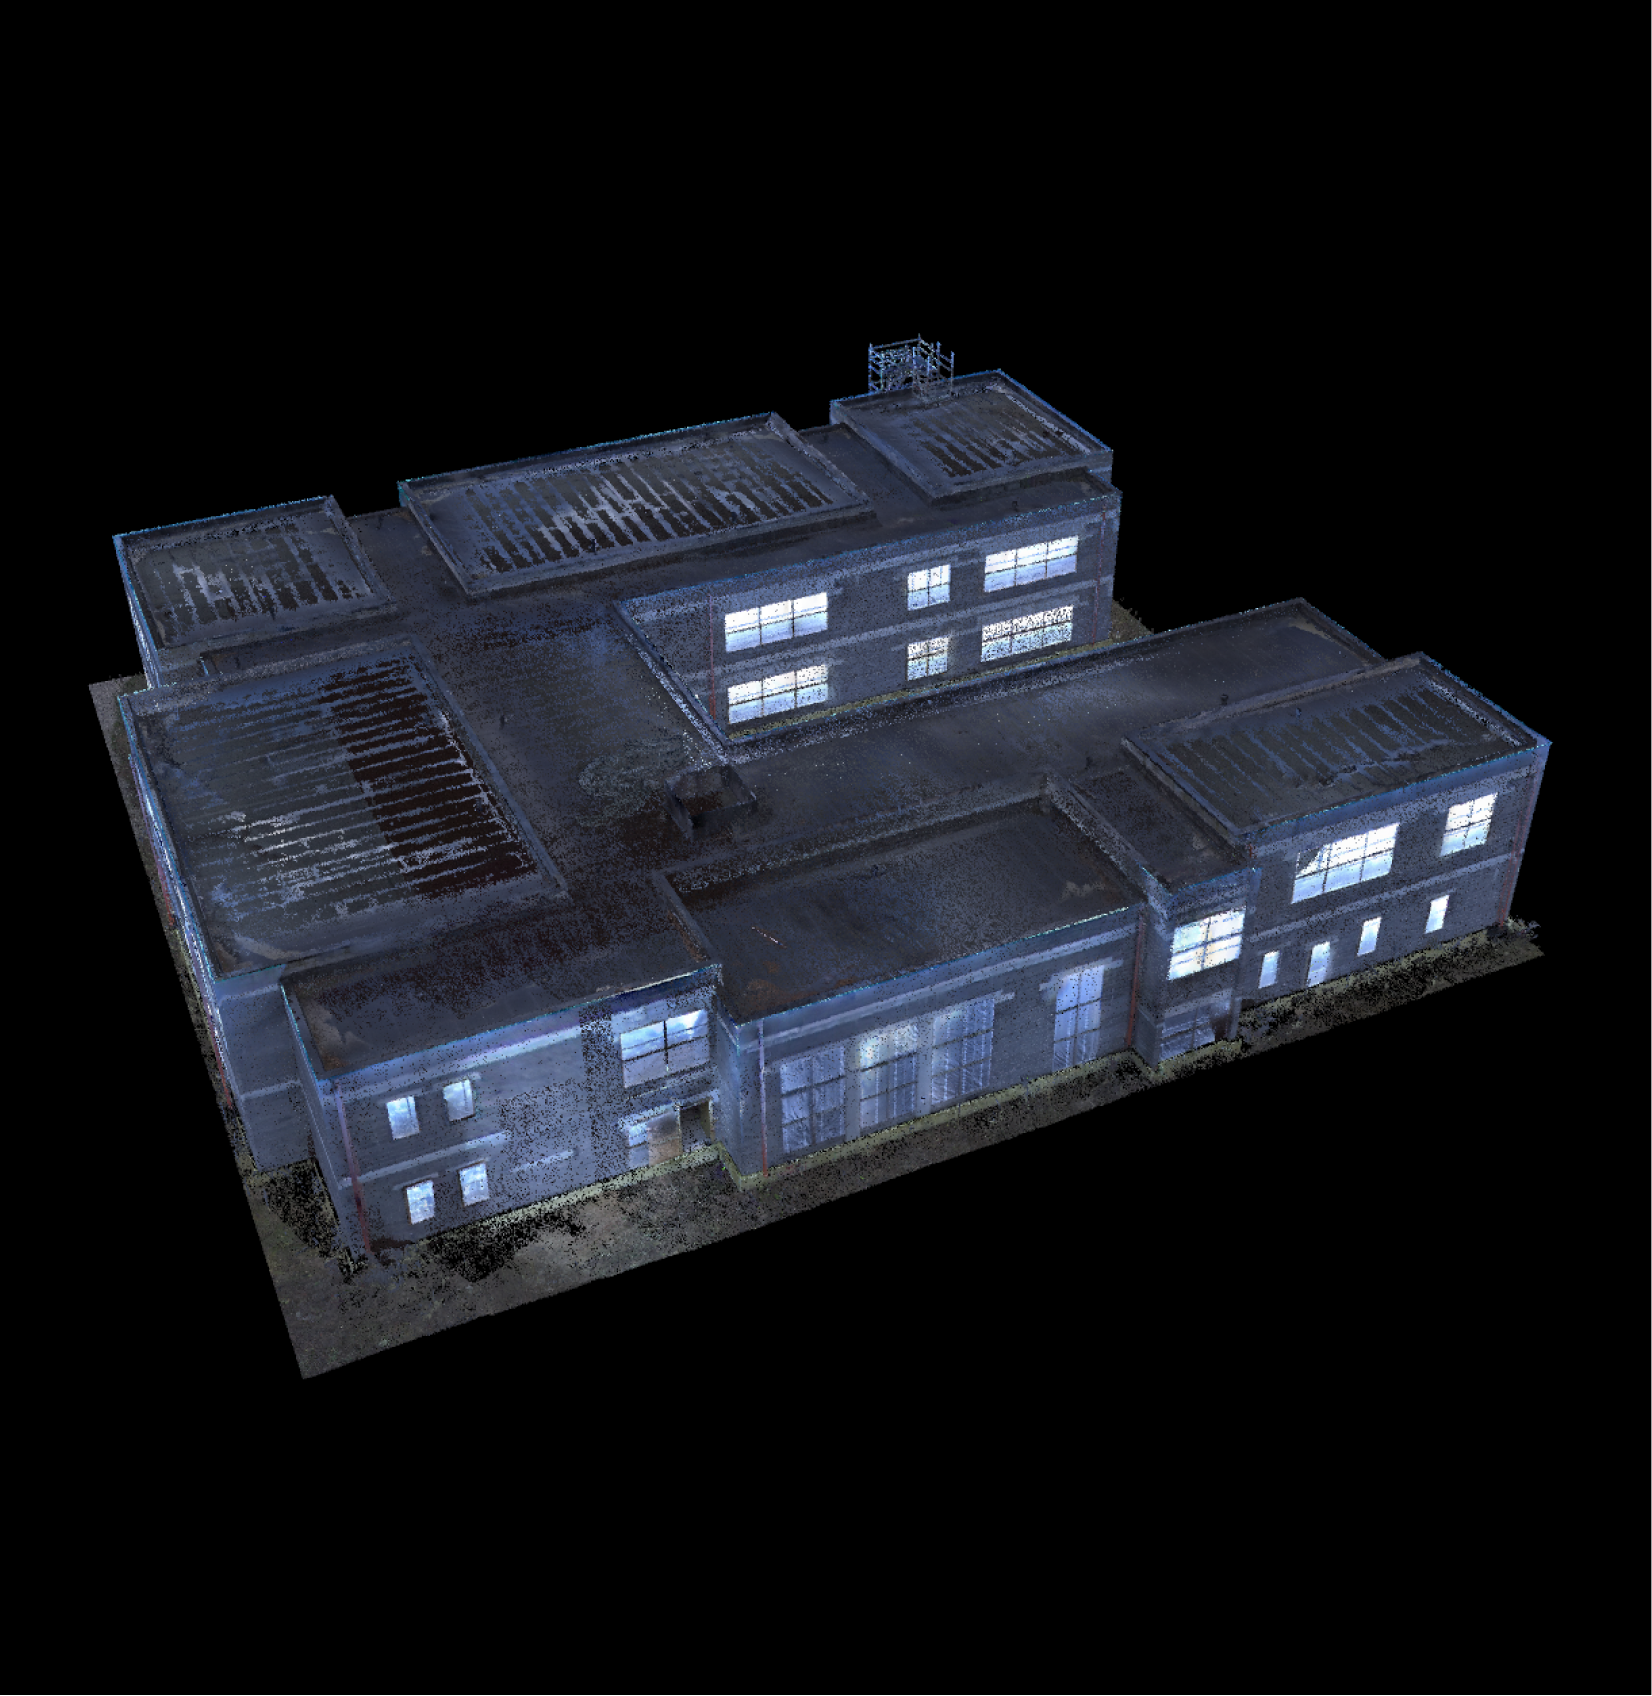
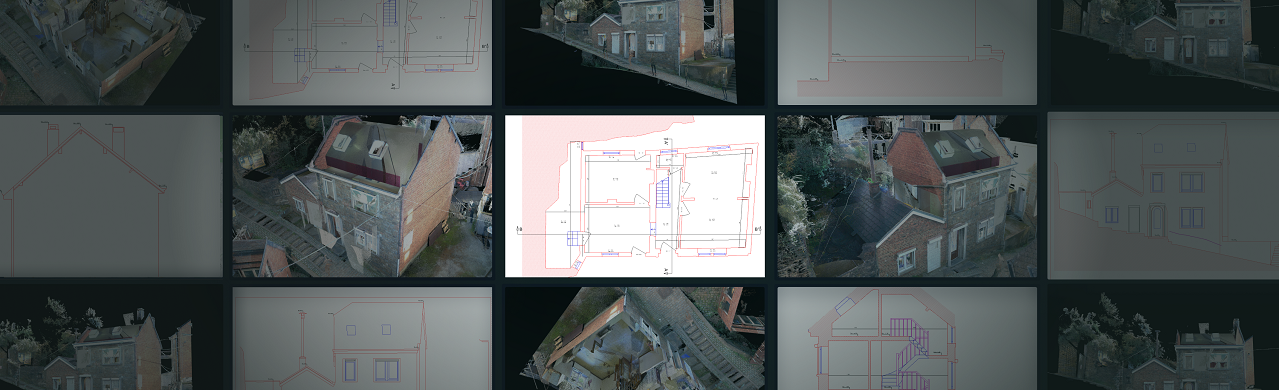
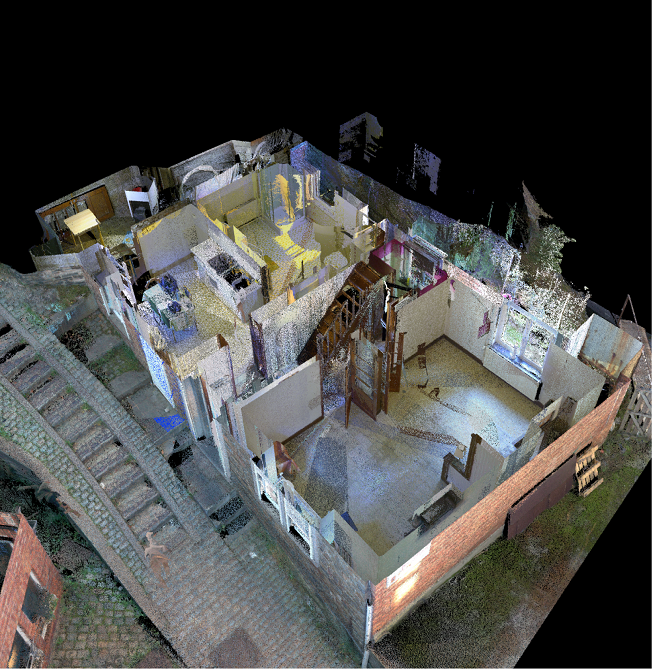
GIS-Point processed the laser scanning data to produce accurate as-built documentation of the building.
The workflow focused on interpreting the point cloud dataset and converting it into structured architectural drawings reflecting the building’s current condition.
Our process included:
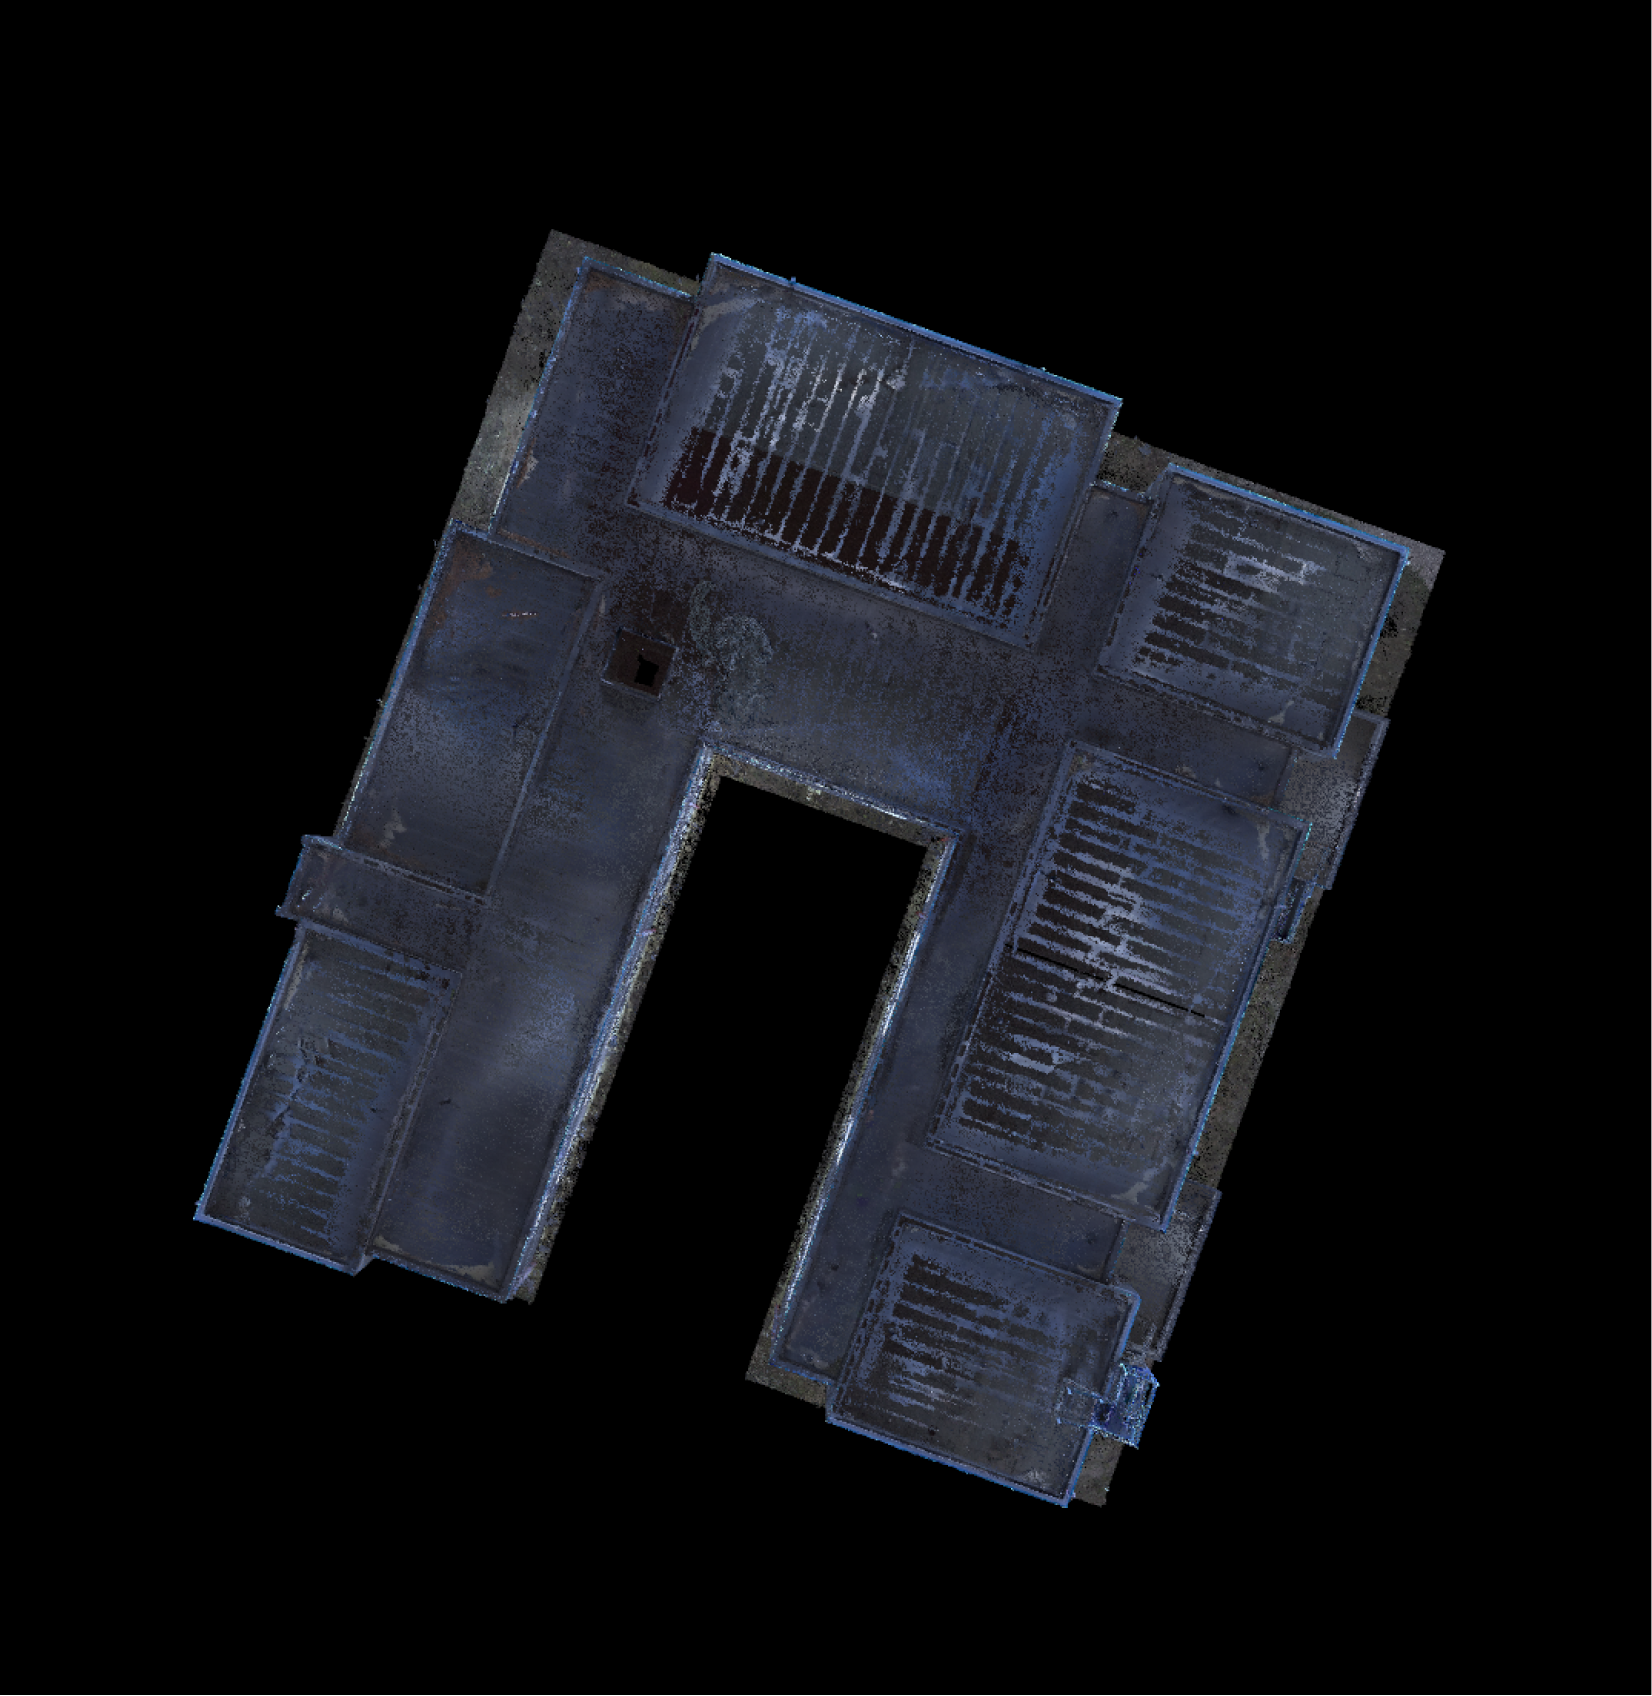
- Importing and processing the point cloud data within the BIM environment to support the as-built documentation process
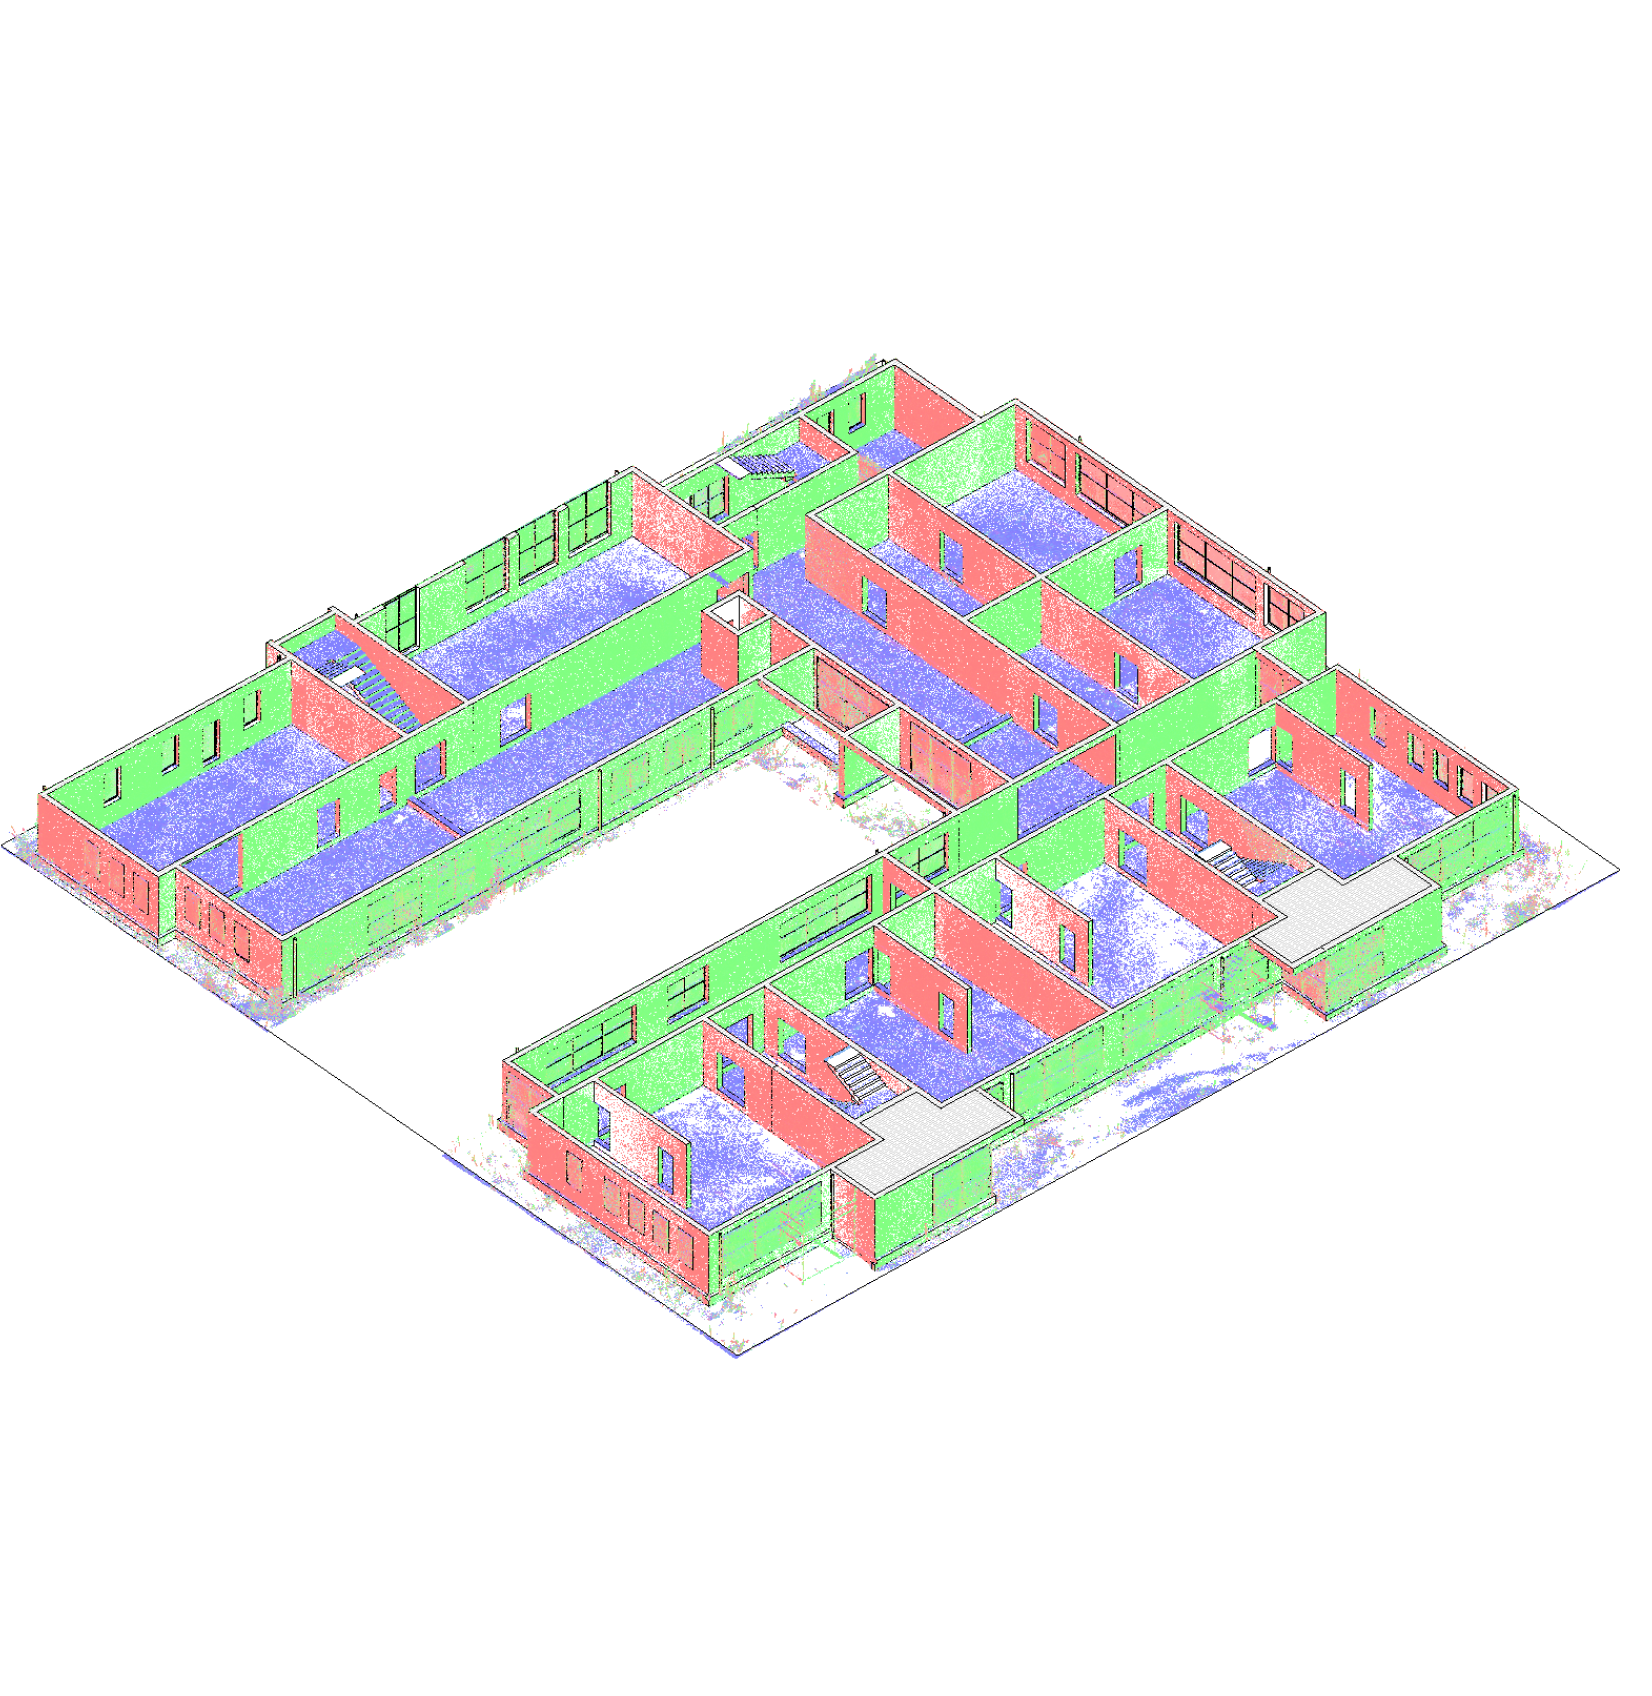
- Analyzing the existing building geometry and developing accurate floor plans and building sections based on the scan data
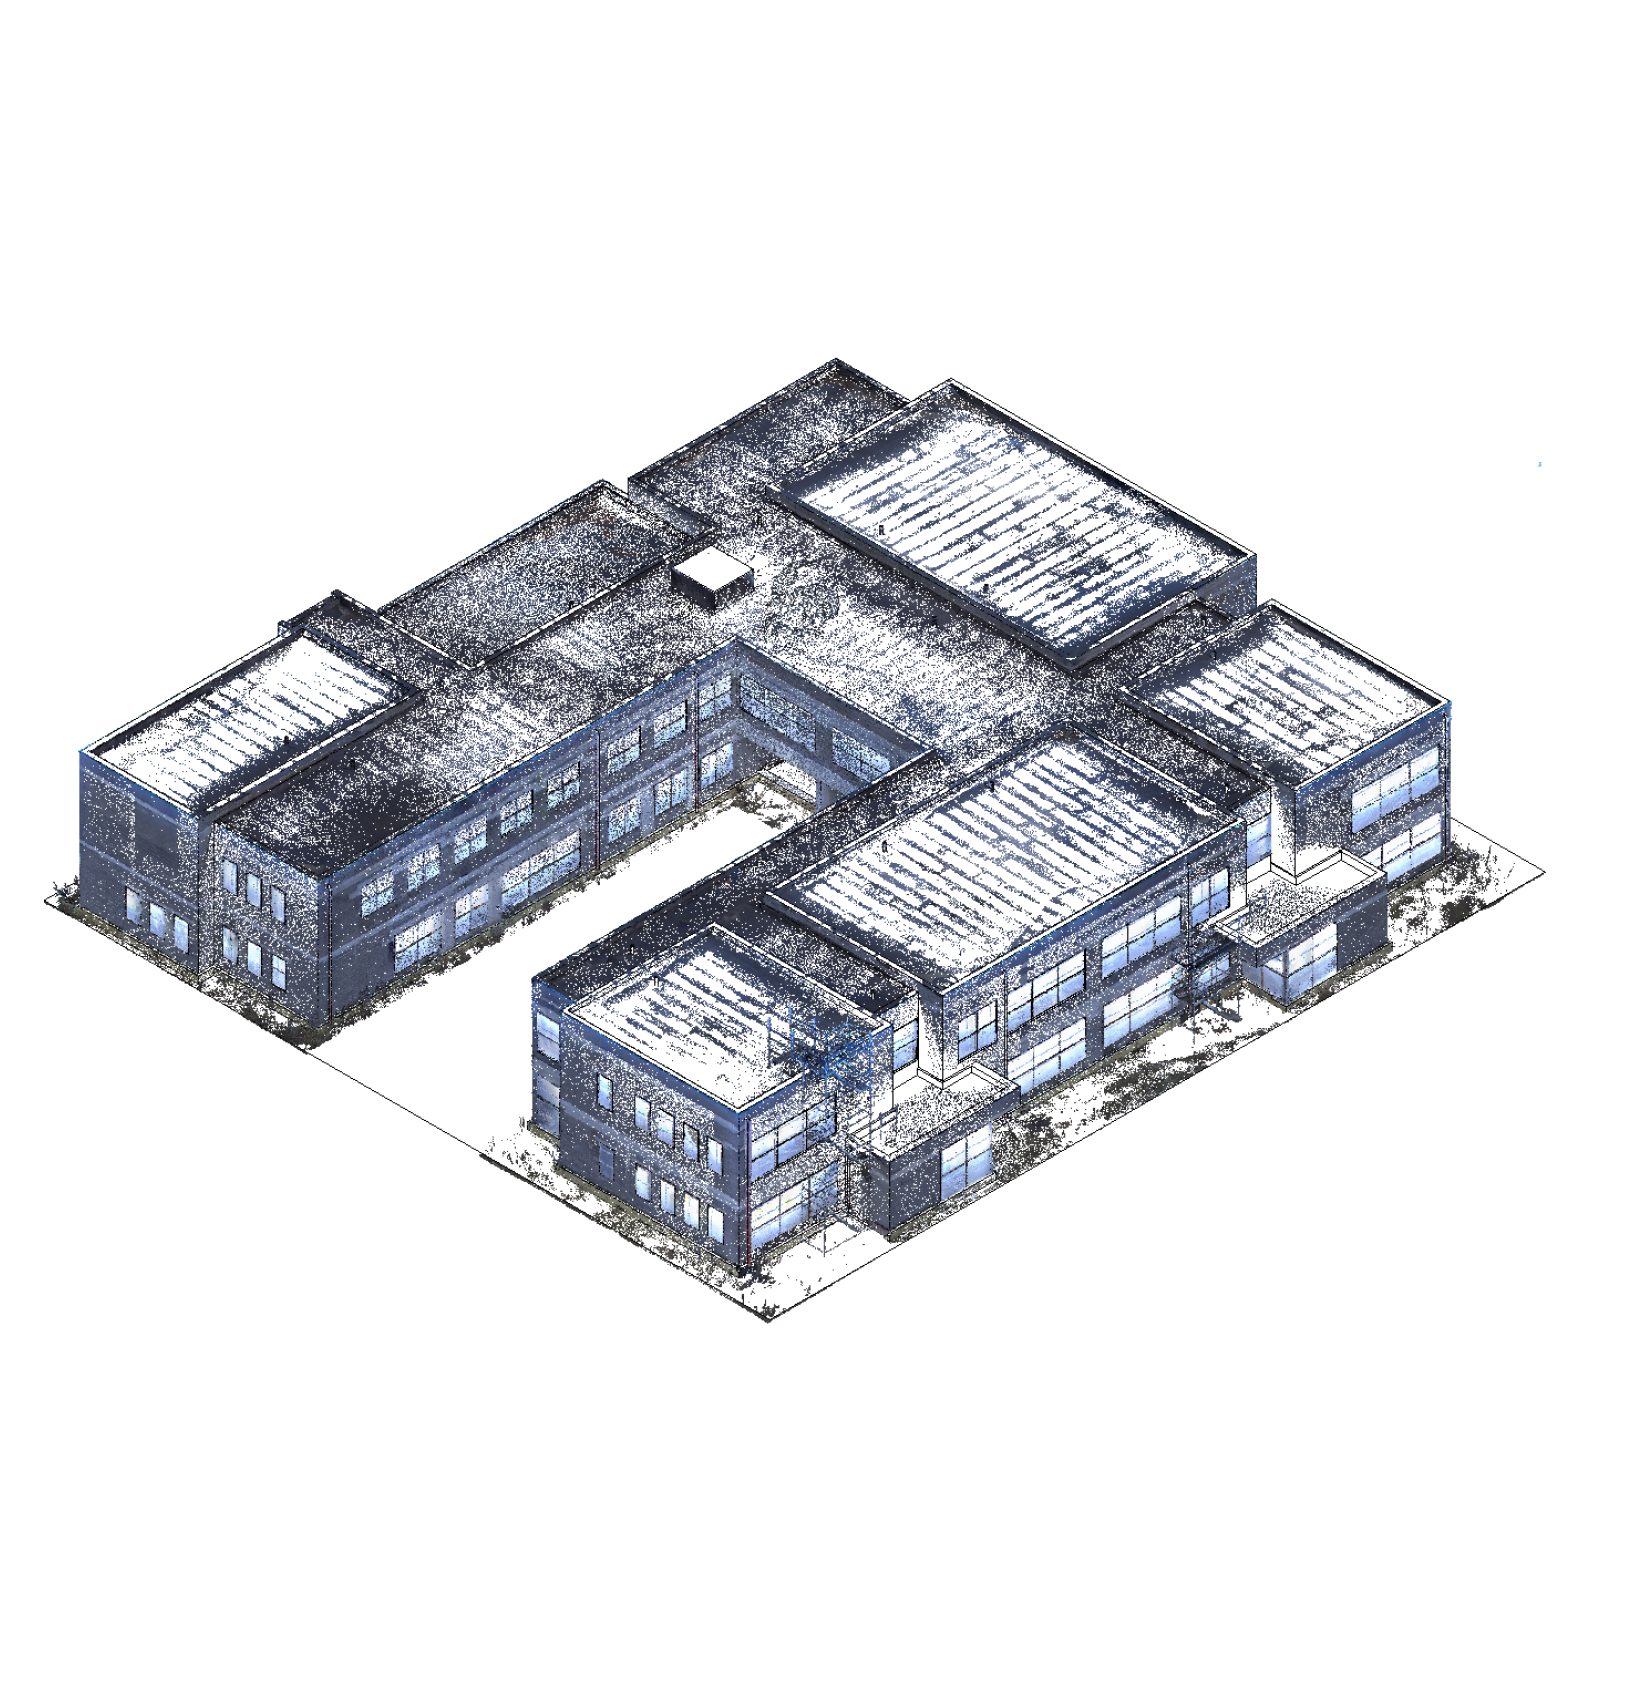
- Creating façade drawings and preparing coordinated architectural documentation reflecting the as-built condition of the structure
Challenges:
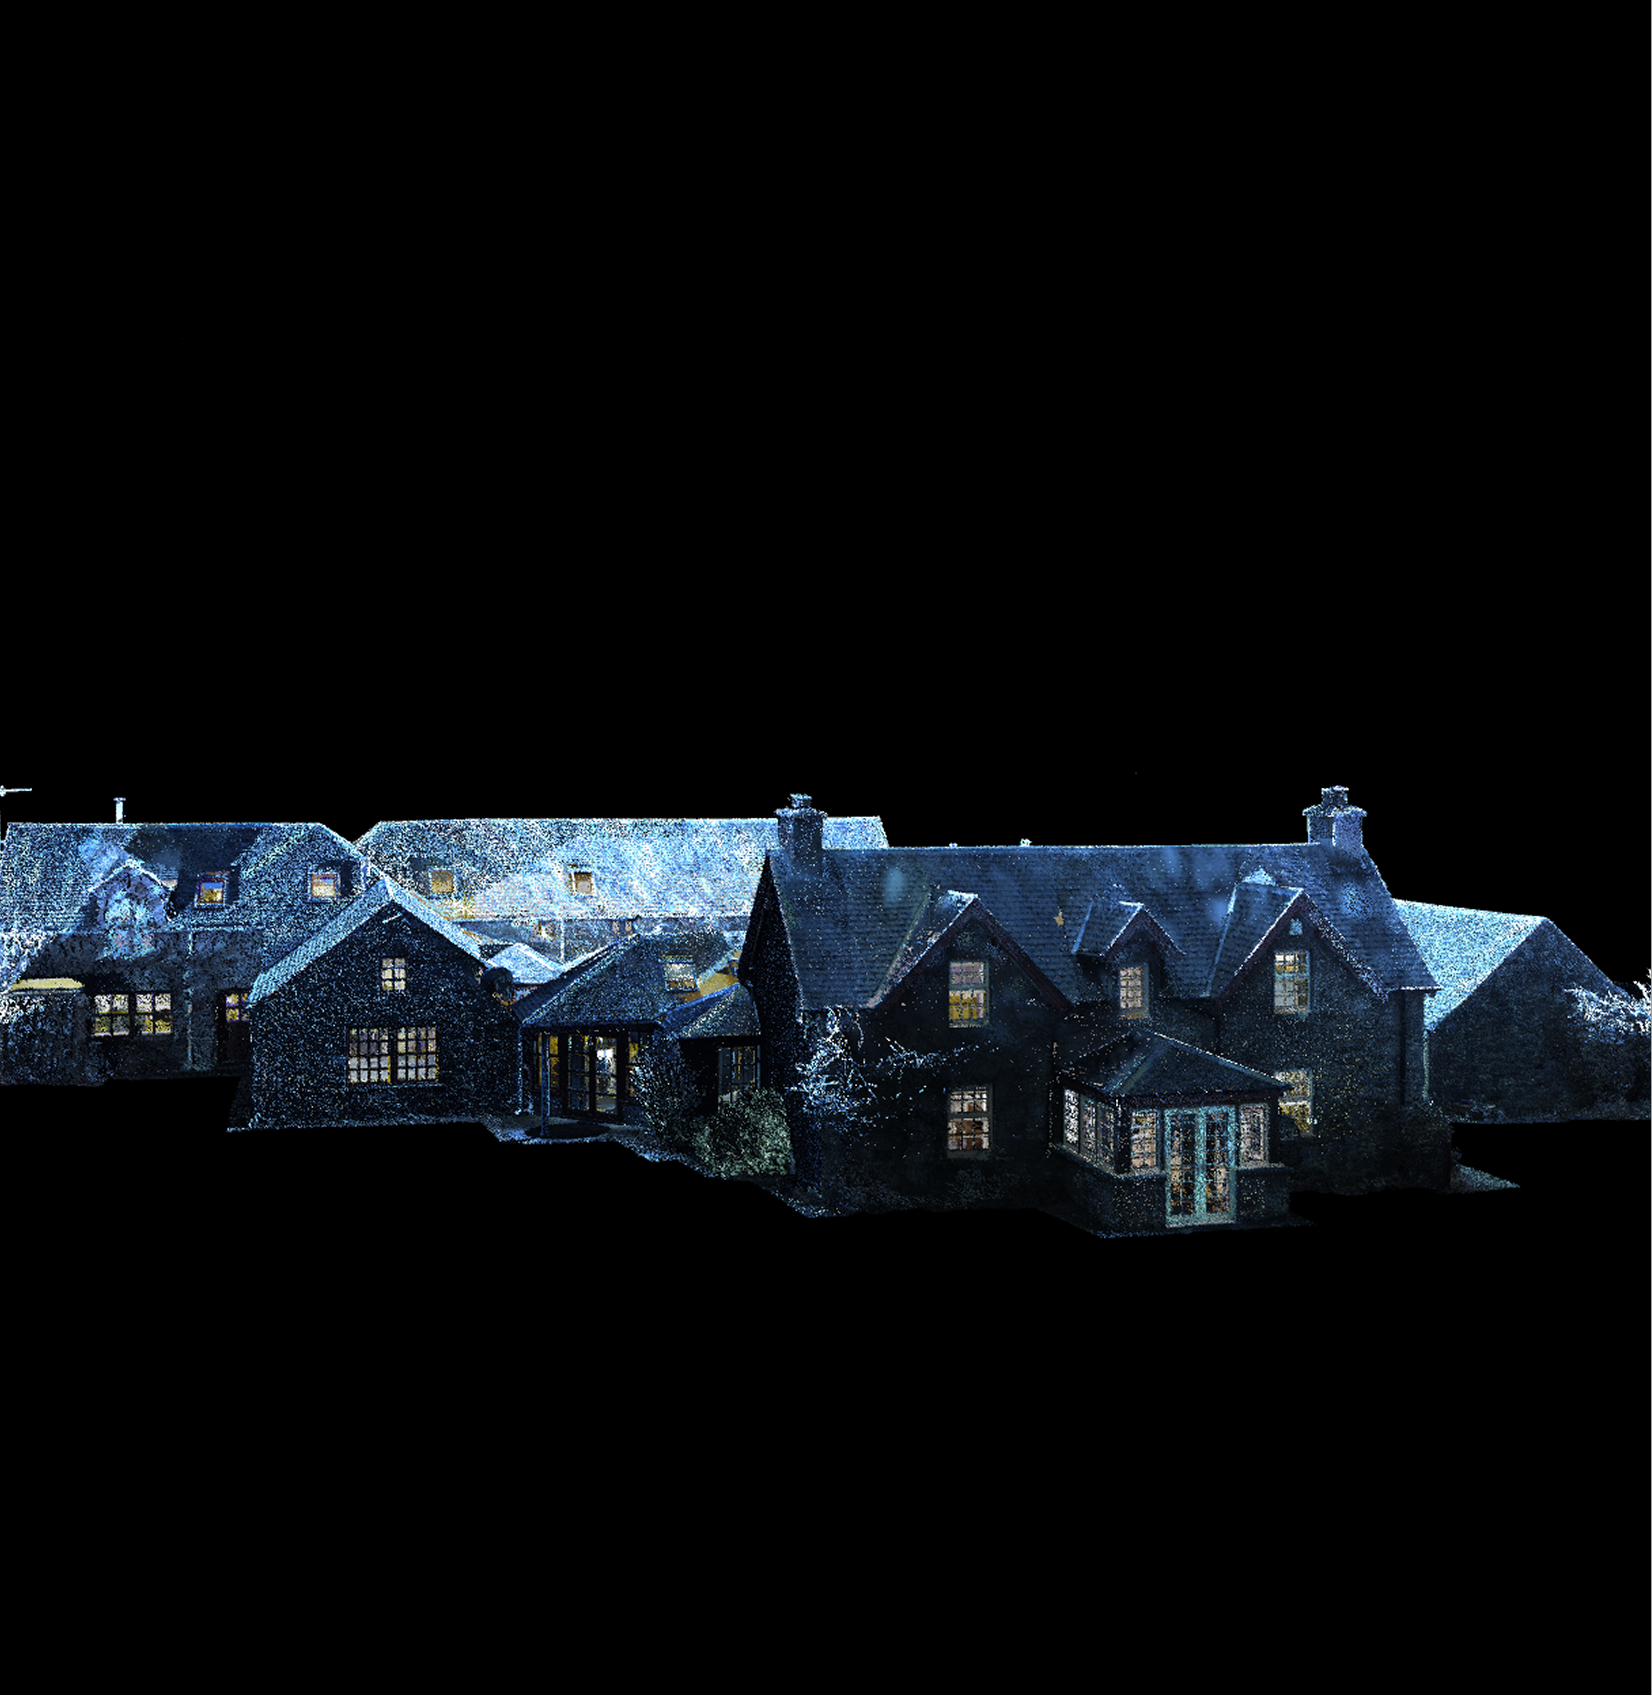
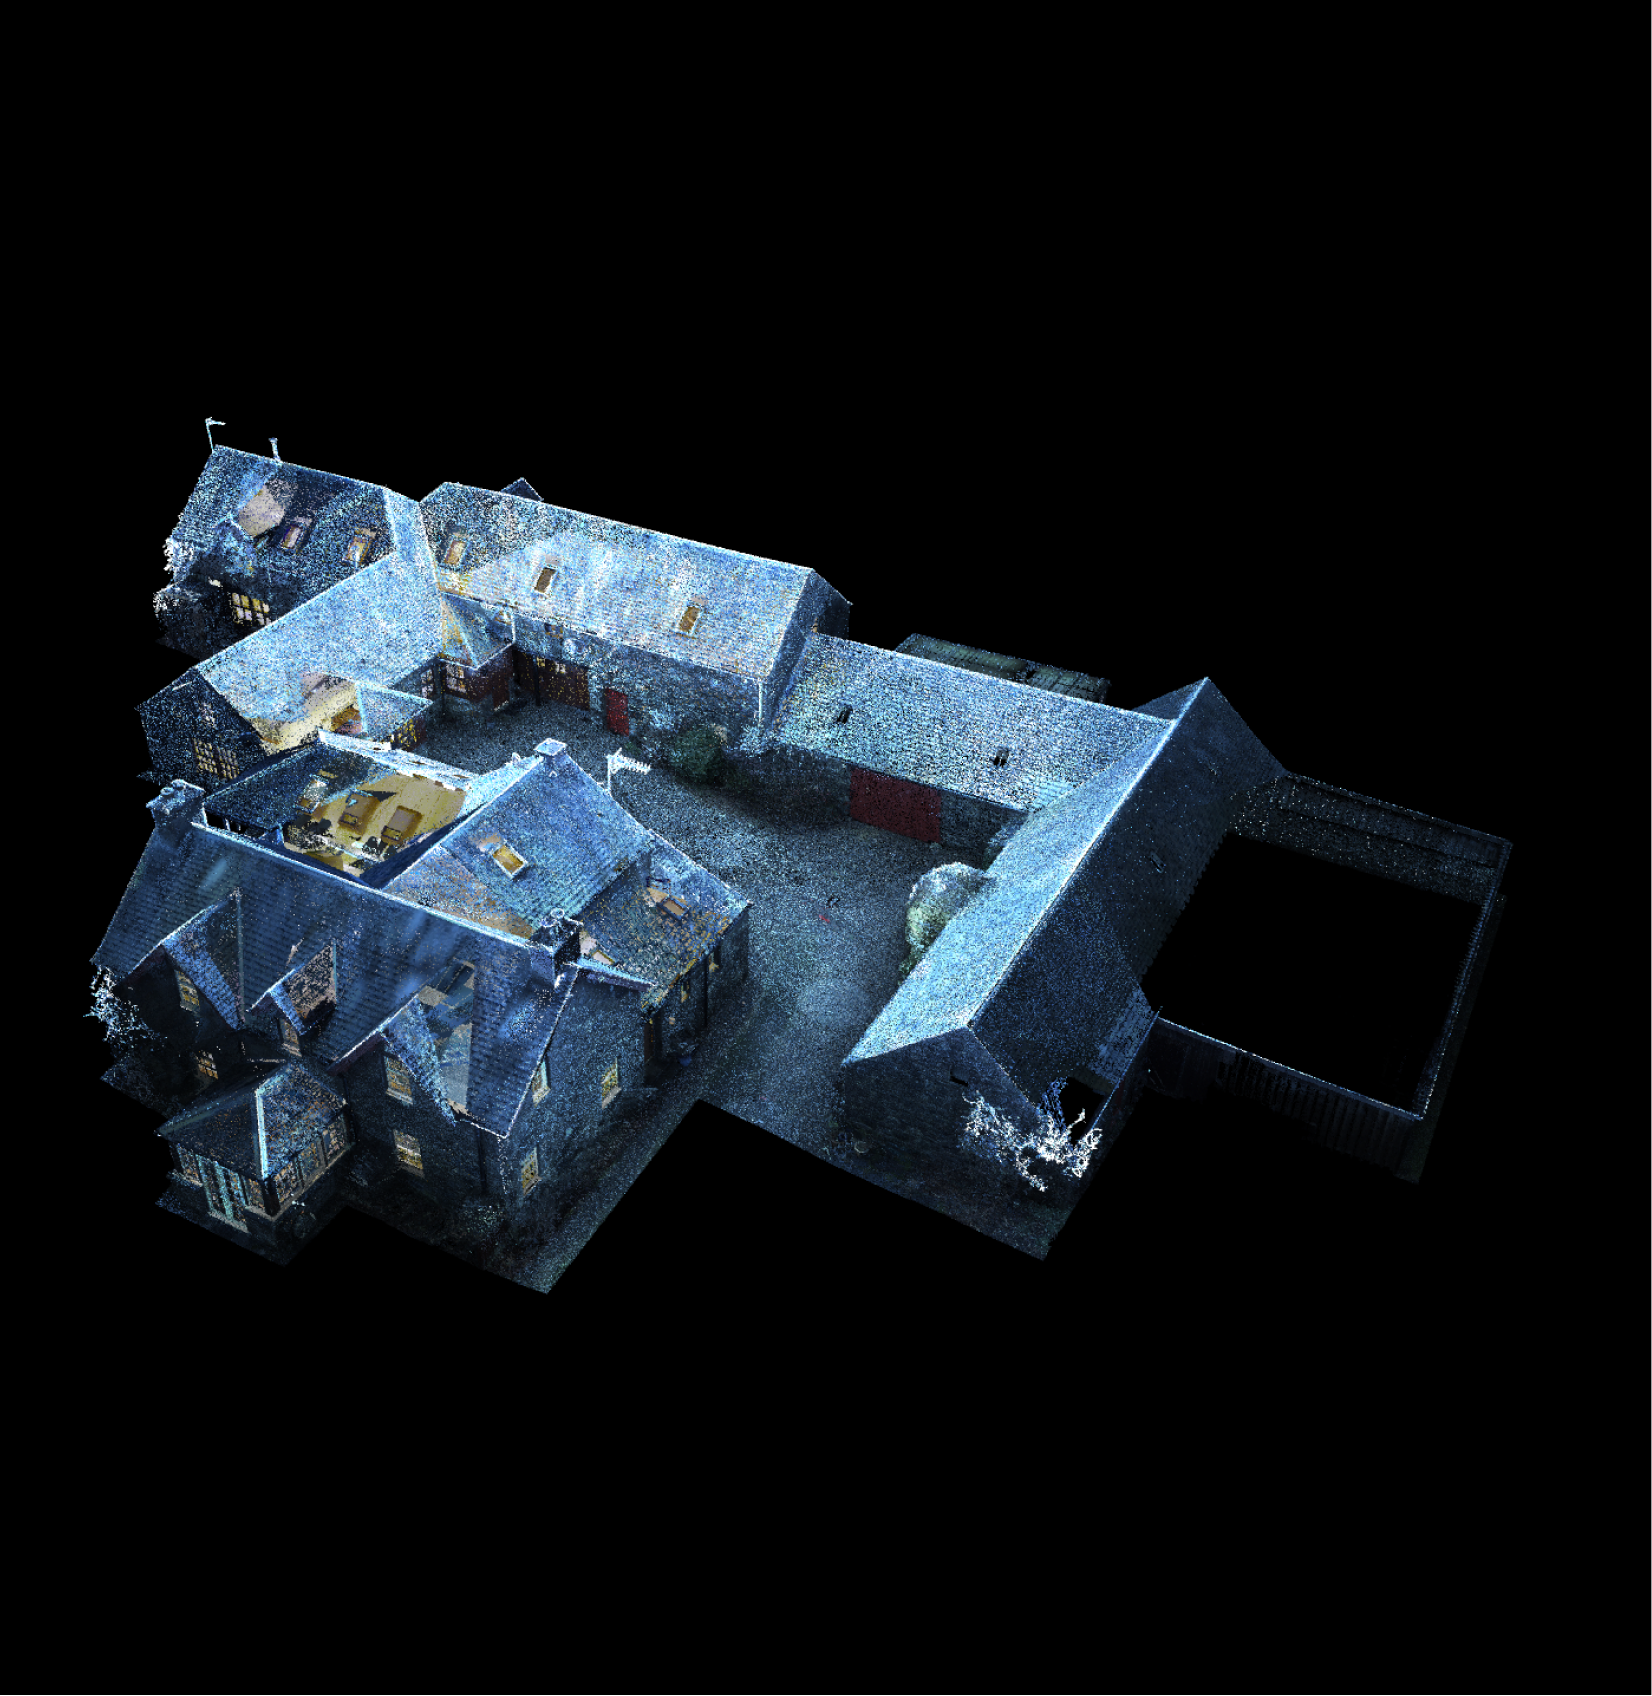
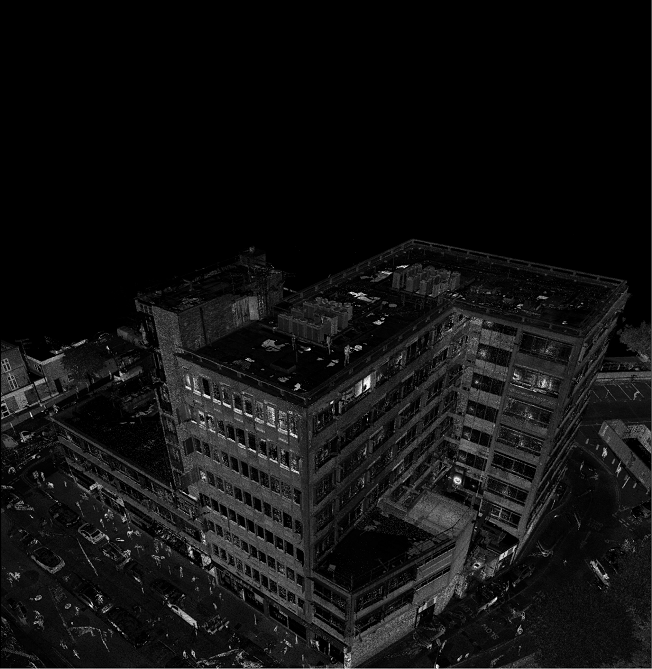
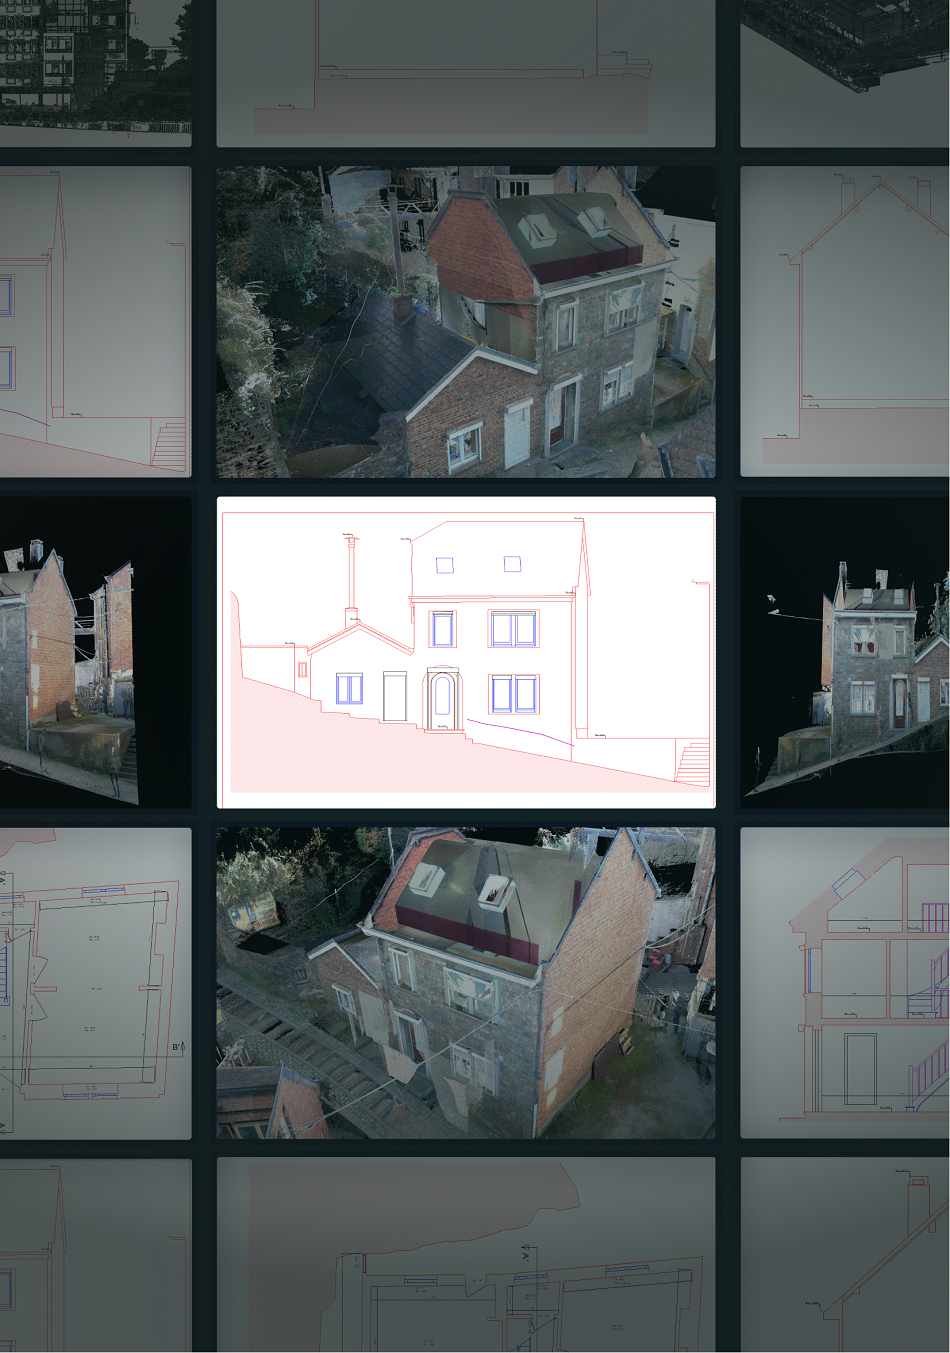
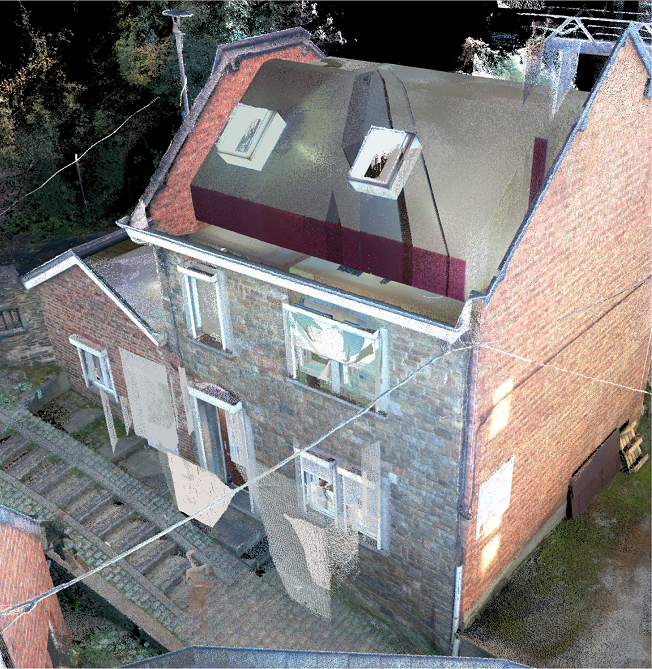
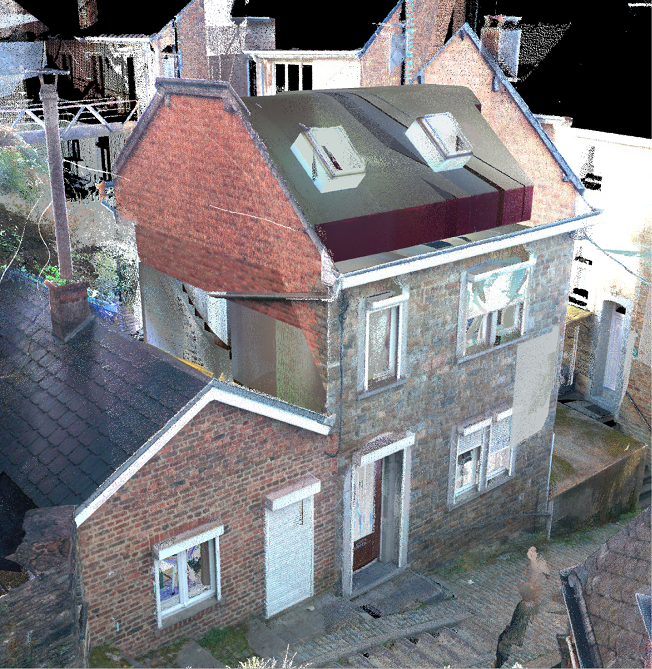
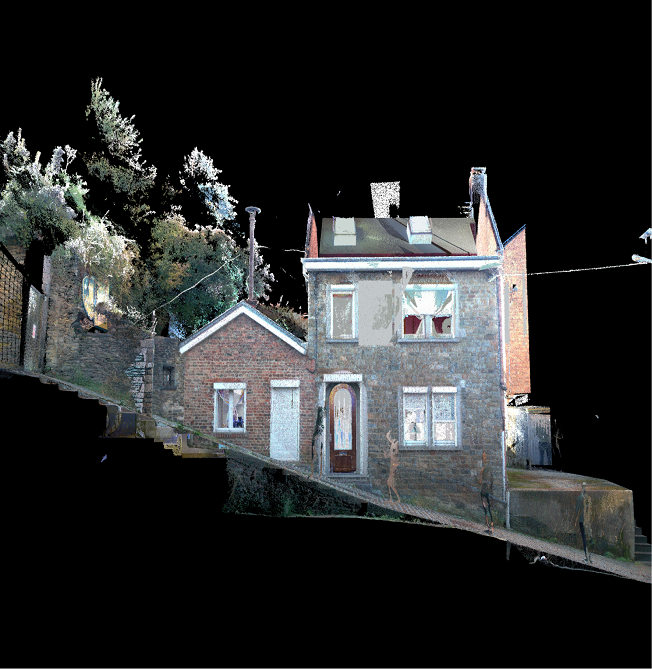
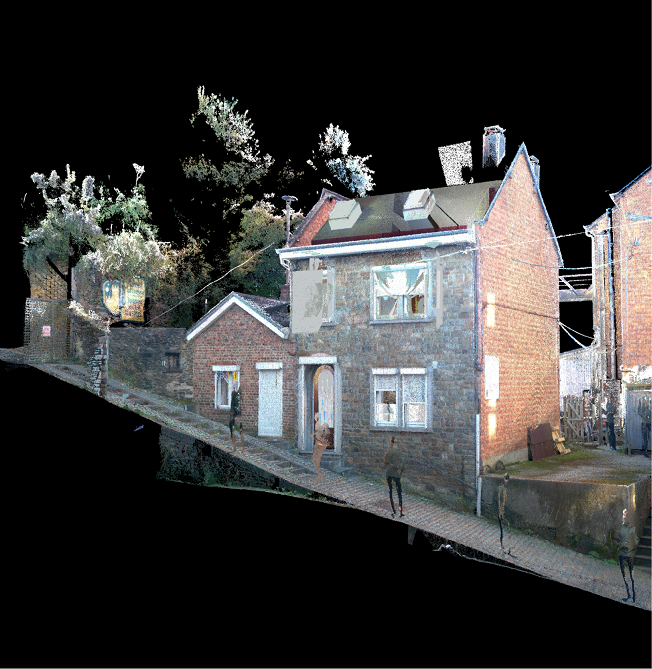
The project involved preparing as-built documentation of an existing building located on a steep rocky terrain. The complexity of the site conditions and the nature of the scan data required careful interpretation of the point cloud and detailed analysis of the building geometry.
Key challenges included:
- Challenging terrain: The building is located on a rocky slope near the castle, which resulted in irregular floor levels and complex structural geometry.
- Dense interior scan data: The interior point cloud contained a large amount of furniture and objects, making it difficult to clearly identify wall boundaries and structural elements.
- Building deformations: As an older structure, the building exhibited noticeable geometric deviations and deformations, requiring careful interpretation of the scan data to produce accurate as-built drawings.
Successfully addressing these challenges ensured the creation of reliable as-built architectural documentation reflecting the real condition of the building.
Result
High-quality as-built architectural documentation was developed from laser scanning data, including precise floor plans, sections, and faсade drawings reflecting the building’s current condition.
Our Team

Ievgen Lavrishko

Khrystyna Bochko

Alevtyna Kostianchuk

Andriiana Pavlyshyn

Roman Nahaiovskyi

Maria Kizim

Ivanna Soltys
Navigating Our Impressive BIM Portfolio
-
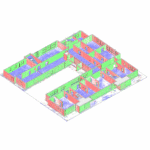
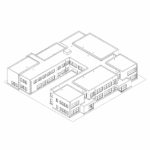
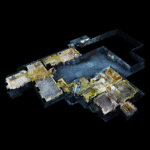
GIS-Point was engaged to develop a BIM model of a two-storey kindergarten building based on available architectural documentation and point cloud data. The project focused on creating an accurate digital representation of the building geometry, including key architectural elements such as walls, floors, roofs, and openings. The resulting BIM model was structured and optimized to support coordination workflows and prepared for export in IFC format to ensure compatibility with industry-standard BIM platforms.
-
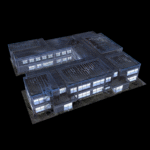
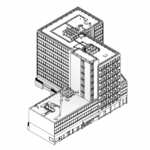
GIS-Point was engaged to update the digital documentation of an existing multi-storey commercial building following significant changes since the previous survey conducted in 2012. The project involved processing newly acquired point cloud data and developing an accurate LOD300 BIM model covering the basement, ground floor, and seven upper levels. The scope included modeling structural elements, architectural components, and visible building services, as well as generating coordinated 2D CAD drawings including floor plans, elevations, and sections at 1:50 scale. The resulting BIM model provides an up-to-date digital representation of the building to support the client’s planning and design process.

-
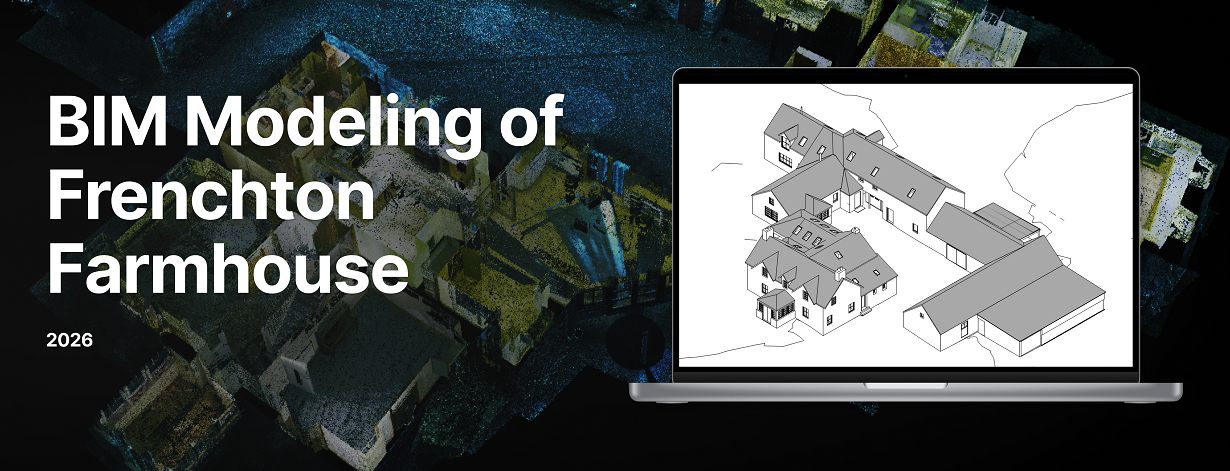
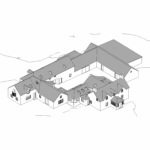
GIS-Point was commissioned to develop a digital BIM model of an existing historic farmhouse based on laser scanning data. The project included point cloud processing and modeling of the building envelope and basic interior layout in Autodesk Revit at LOD 300.

-
GIS-Point was engaged to process the laser scan data and produce accurate architectural drawings of the building. Using the provided point cloud dataset, the team analyzed the existing structure and developed detailed floor plans, building sections, and façade drawings reflecting the current condition of the property. The project focused on transforming complex survey data into clear and structured documentation to support further architectural and engineering work.

Working on the Project:
A Step-by-Step Journey to Success
PREPARATION
task, provide samples, templates,
instructions.
PILOT PROJECT
for FREE, according to all your
instructions.
AGREEMENT
the cost of further work.
LET’S STARTED!
NDA, after which our team gets to
work.
Have a similar project?
Contact us, we’ll help with its implementation.
United Kingdom
Devonshire str., 41, Ground Floor, London W1G 7AJ, UK
Estonia
Harju maakond, Tallinn, Kesklinna linnaosa, Kaupmehe tn 7-120, 10114, Estonia
Ukraine
Ukraine, Lviv, Sadova street, 2a/1
+380672088520 Ievgen Lavrishko
info@gis-point.com