
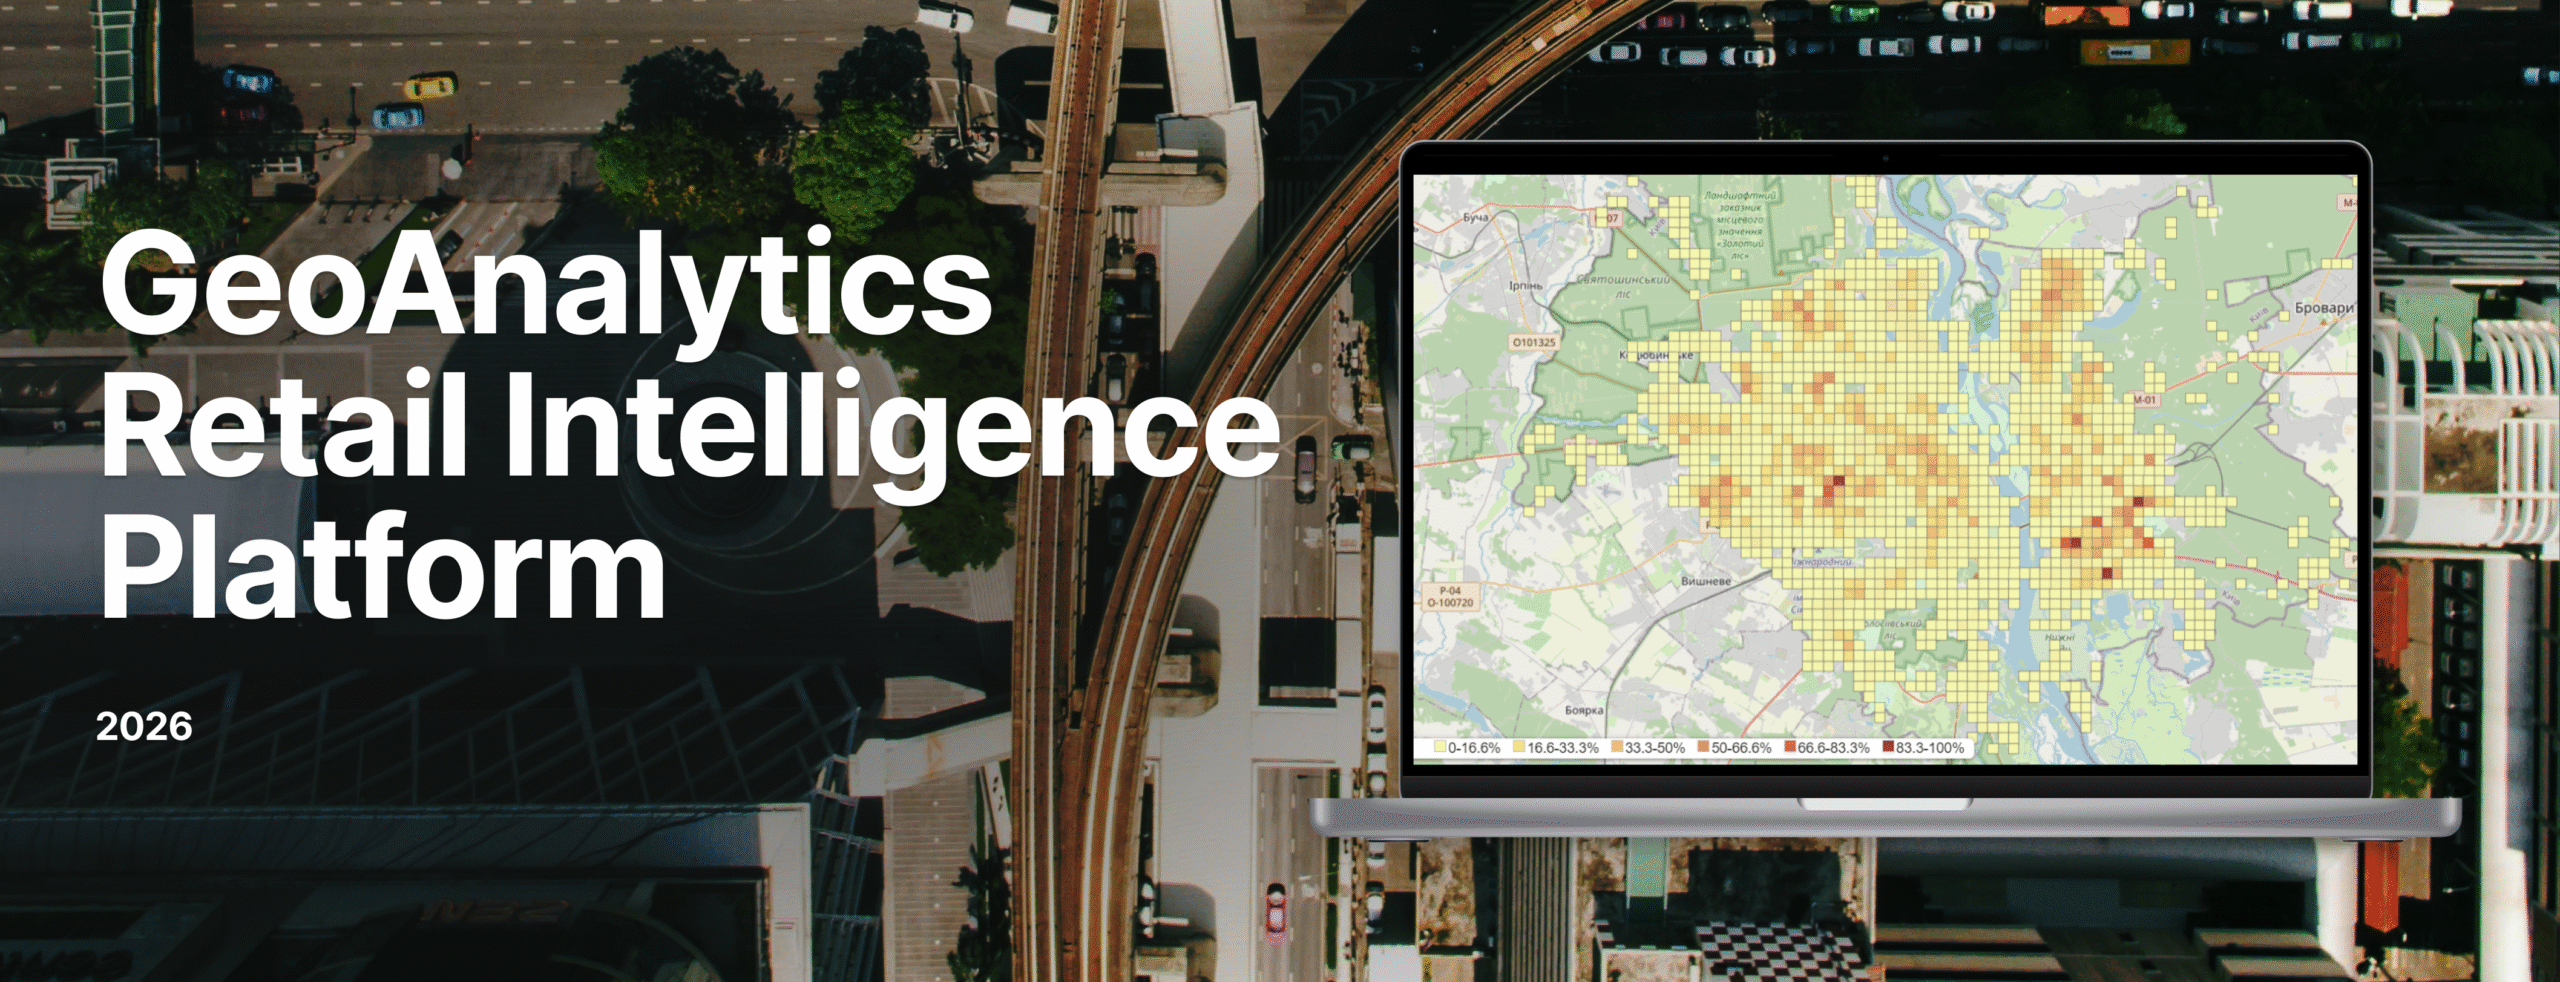
Project Overview
A large European retail chain was planning rapid expansion and needed a faster way to evaluate potential store locations. GIS-Point developed a GeoAnalytics platform that consolidates mobility, population, and competitive data into a single analytical environment, enabling the client to assess new locations through automated spatial analytics and interactive maps.
Client: Confidential Retail Chain (NDA).
Sector: Retail
Sub Sector: Multi-location retail network expansion
Location: Europe
Challenge & Solution
Challenge:
A large retail chain planning rapid network expansion faced difficulties evaluating potential store locations. Data related to mobility, population density, and competitors was scattered across multiple departments and formats, making analysis slow and inconsistent.
Location assessments relied heavily on manual field surveys and fragmented spreadsheets. This process required weeks of work for each potential site, increased operational costs, and limited the number of locations the company could evaluate simultaneously.
At the same time, the client needed to ensure strict data privacy compliance, including k-anonymity requirements, while still extracting meaningful insights from mobility data.
Solution:
GeoAnalytics Location Selection Platform was developed – a unified digital solution that transforms fragmented location data into clear, actionable insights.
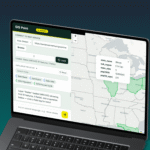
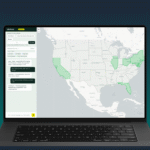
The platform integrates geospatial datasets, mobility analytics, and business intelligence tools into a single environment. Instead of manual analysis, the system automates location evaluation and provides interactive visualizations that allow decision-makers to assess new store opportunities within minutes.
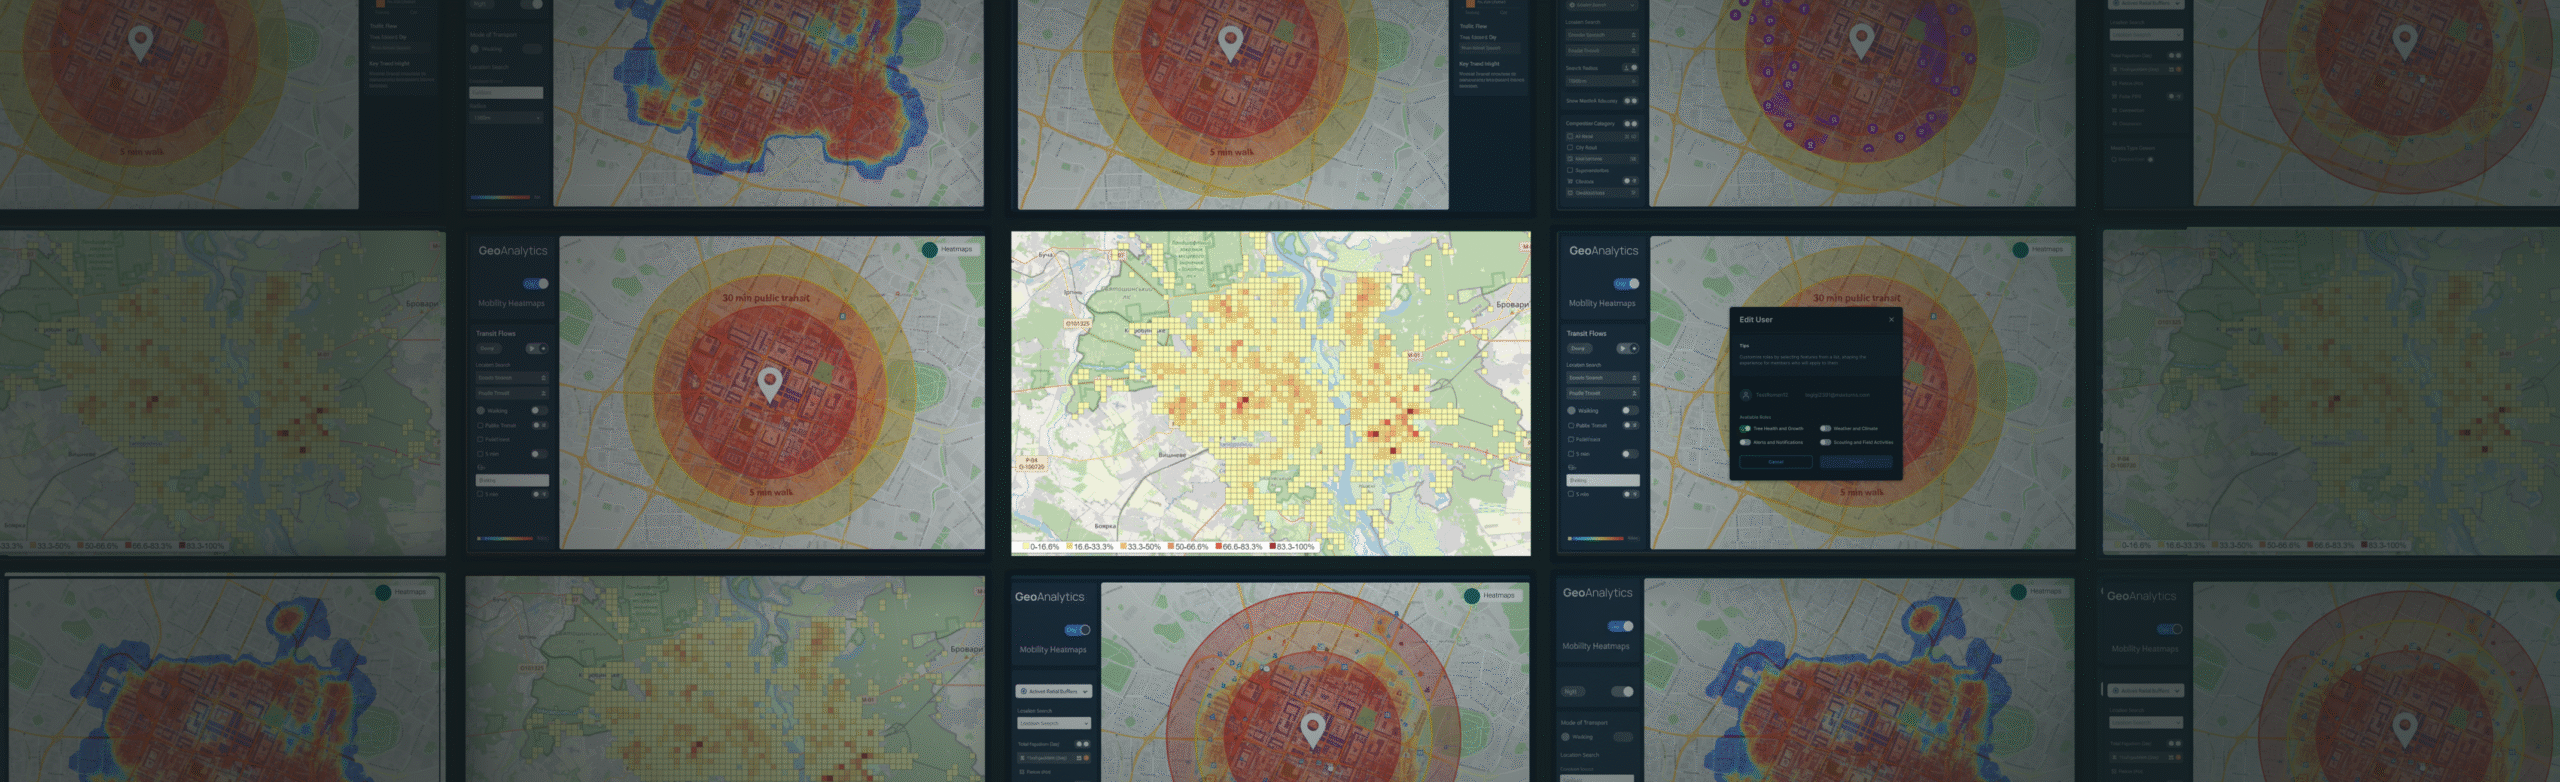
Platform Capabilities
The platform delivers comprehensive analytics for each location:
- Nighttime resident and daytime worker density
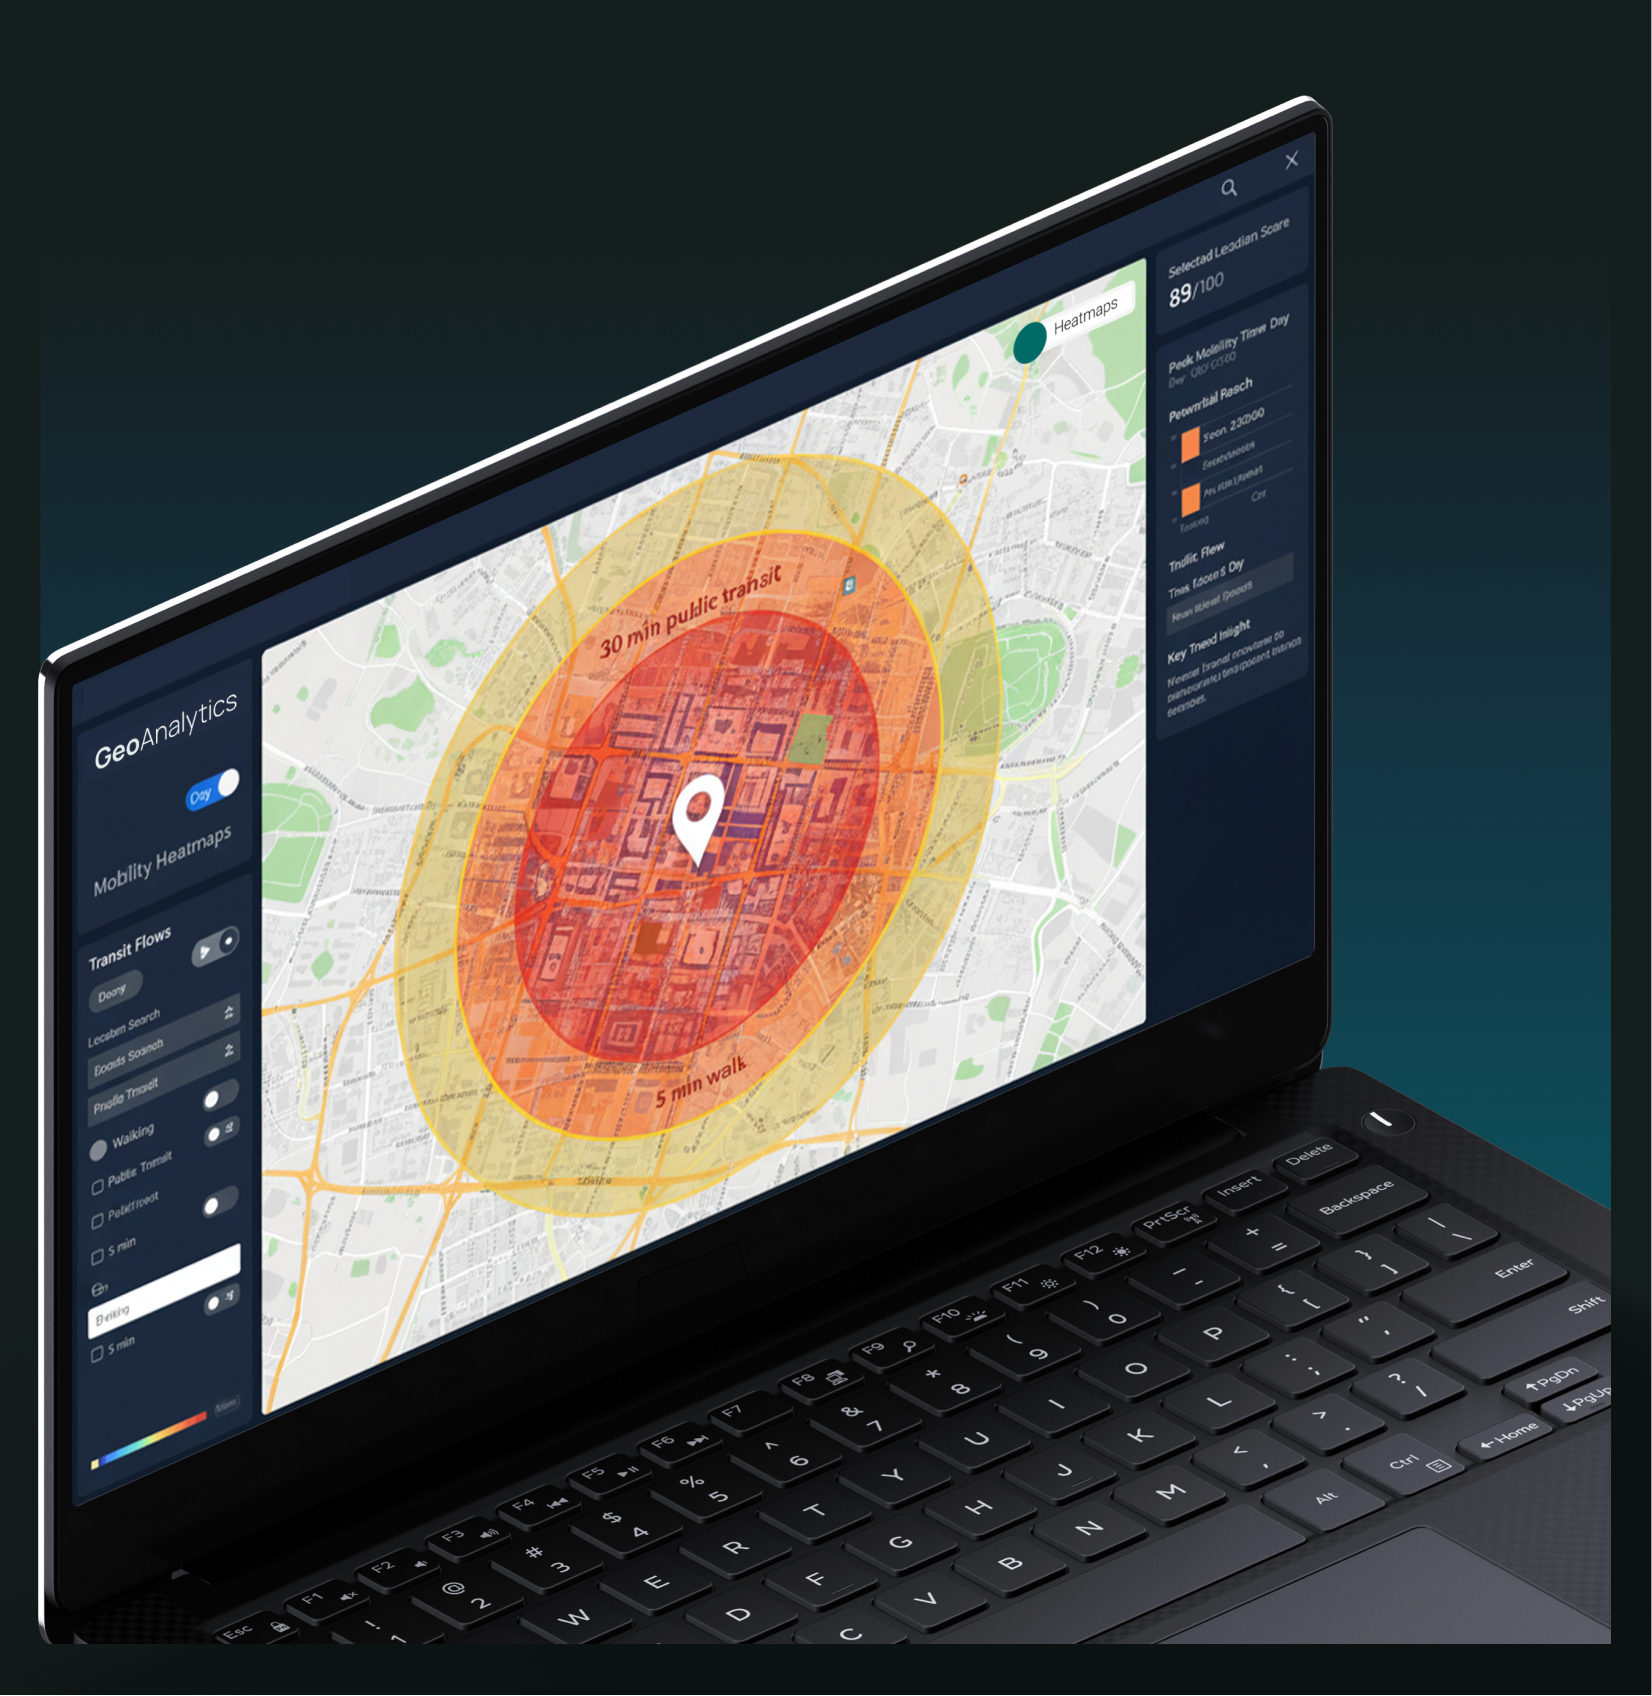
- Transit flows for pedestrians and vehicles
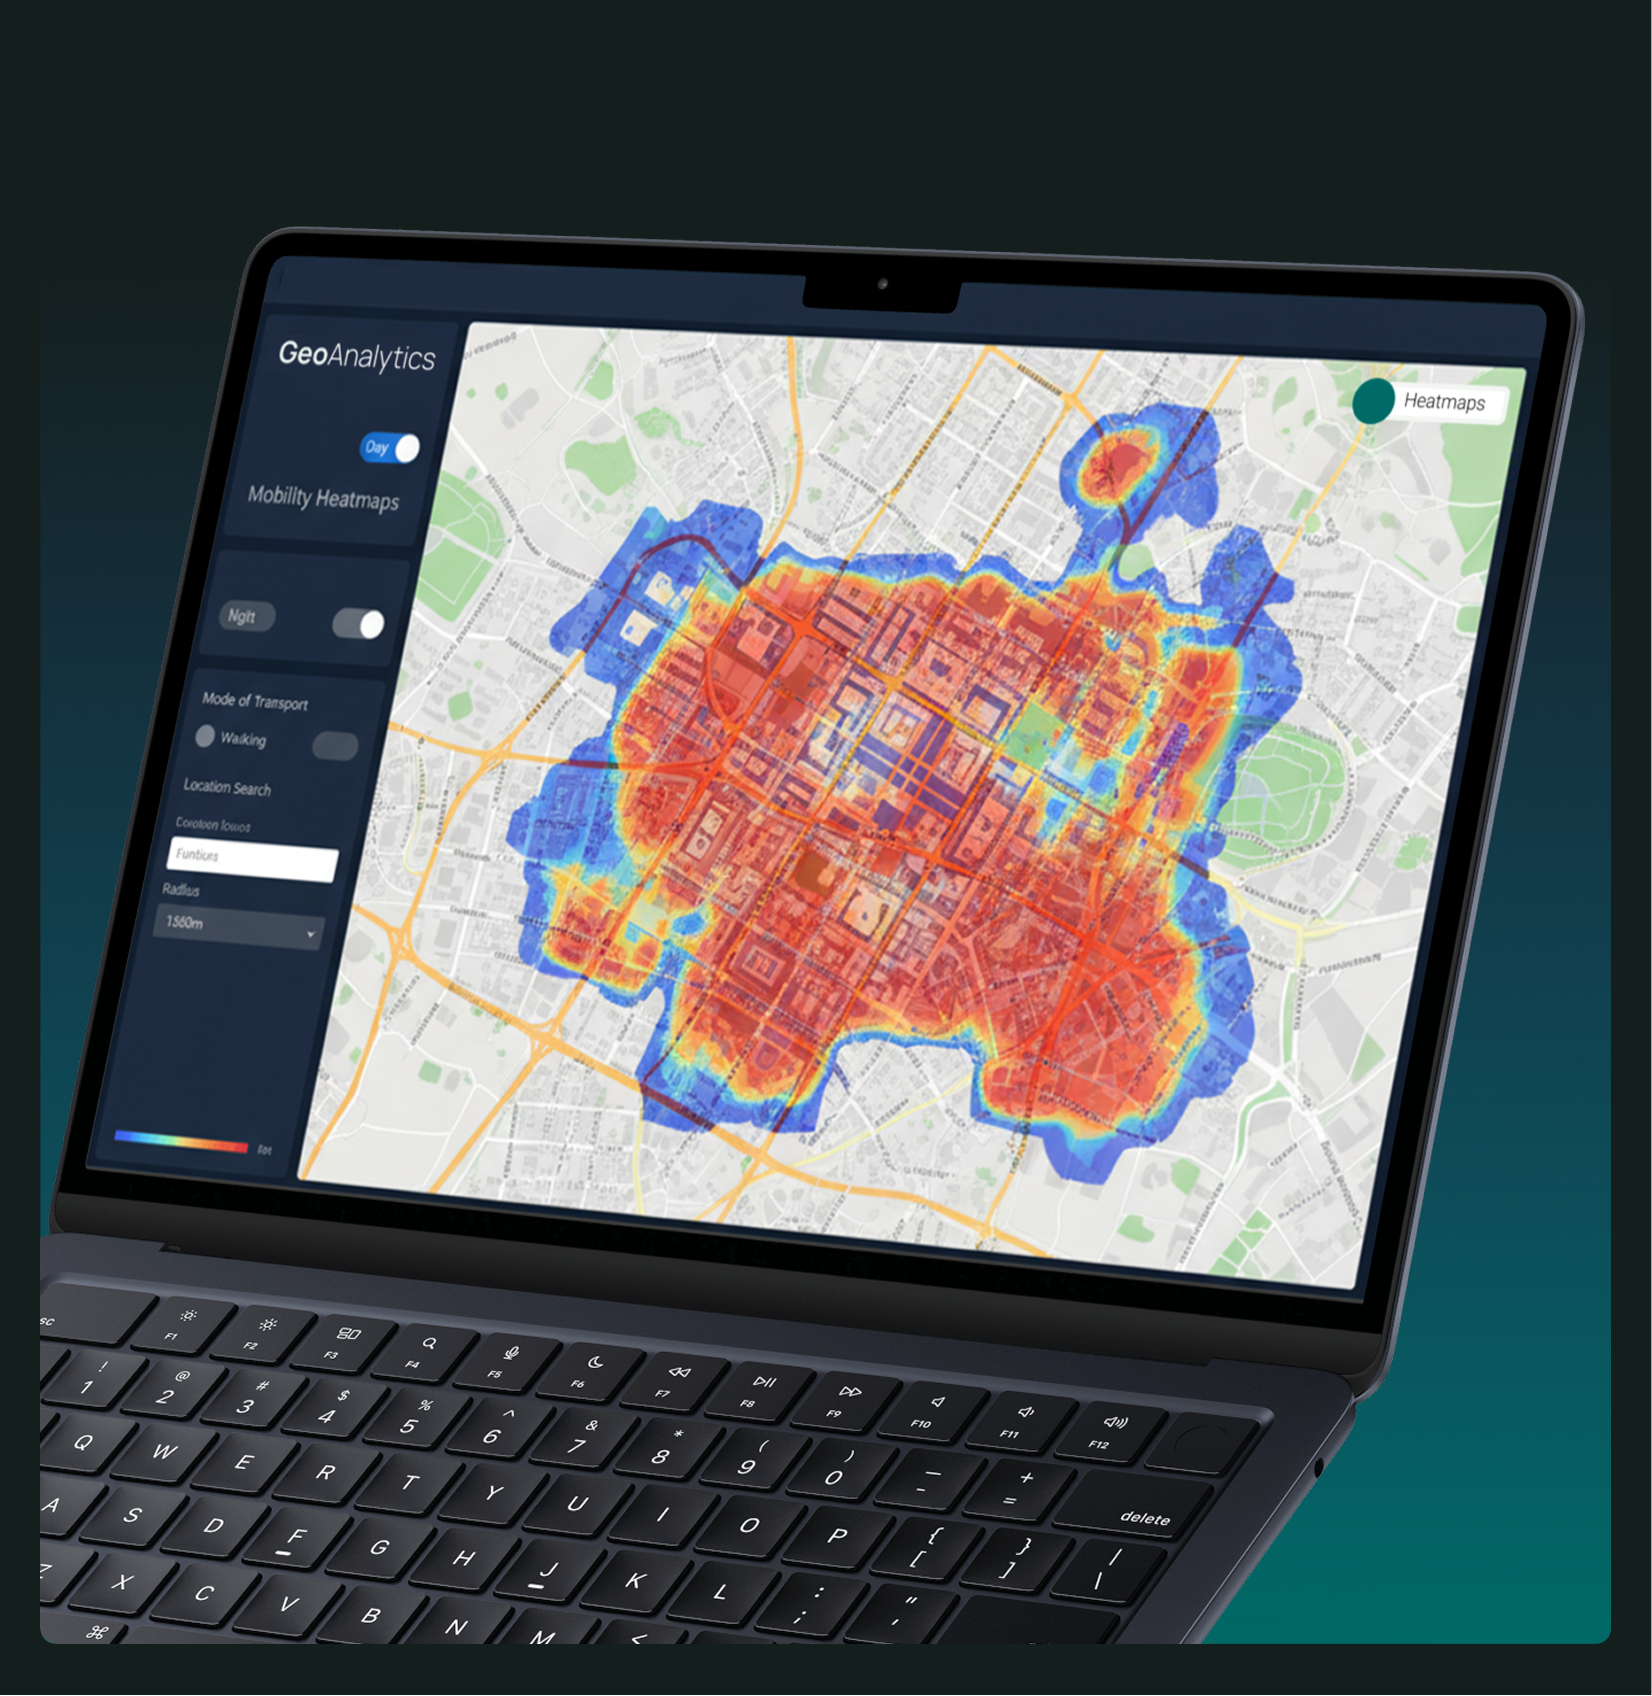
- Heatmaps for demand, mobility, and competitive density
- Dynamic aggregation across four radius buffers (500–1500 m)
- Exportable reports in XLSX/CSV formats
Key Services:
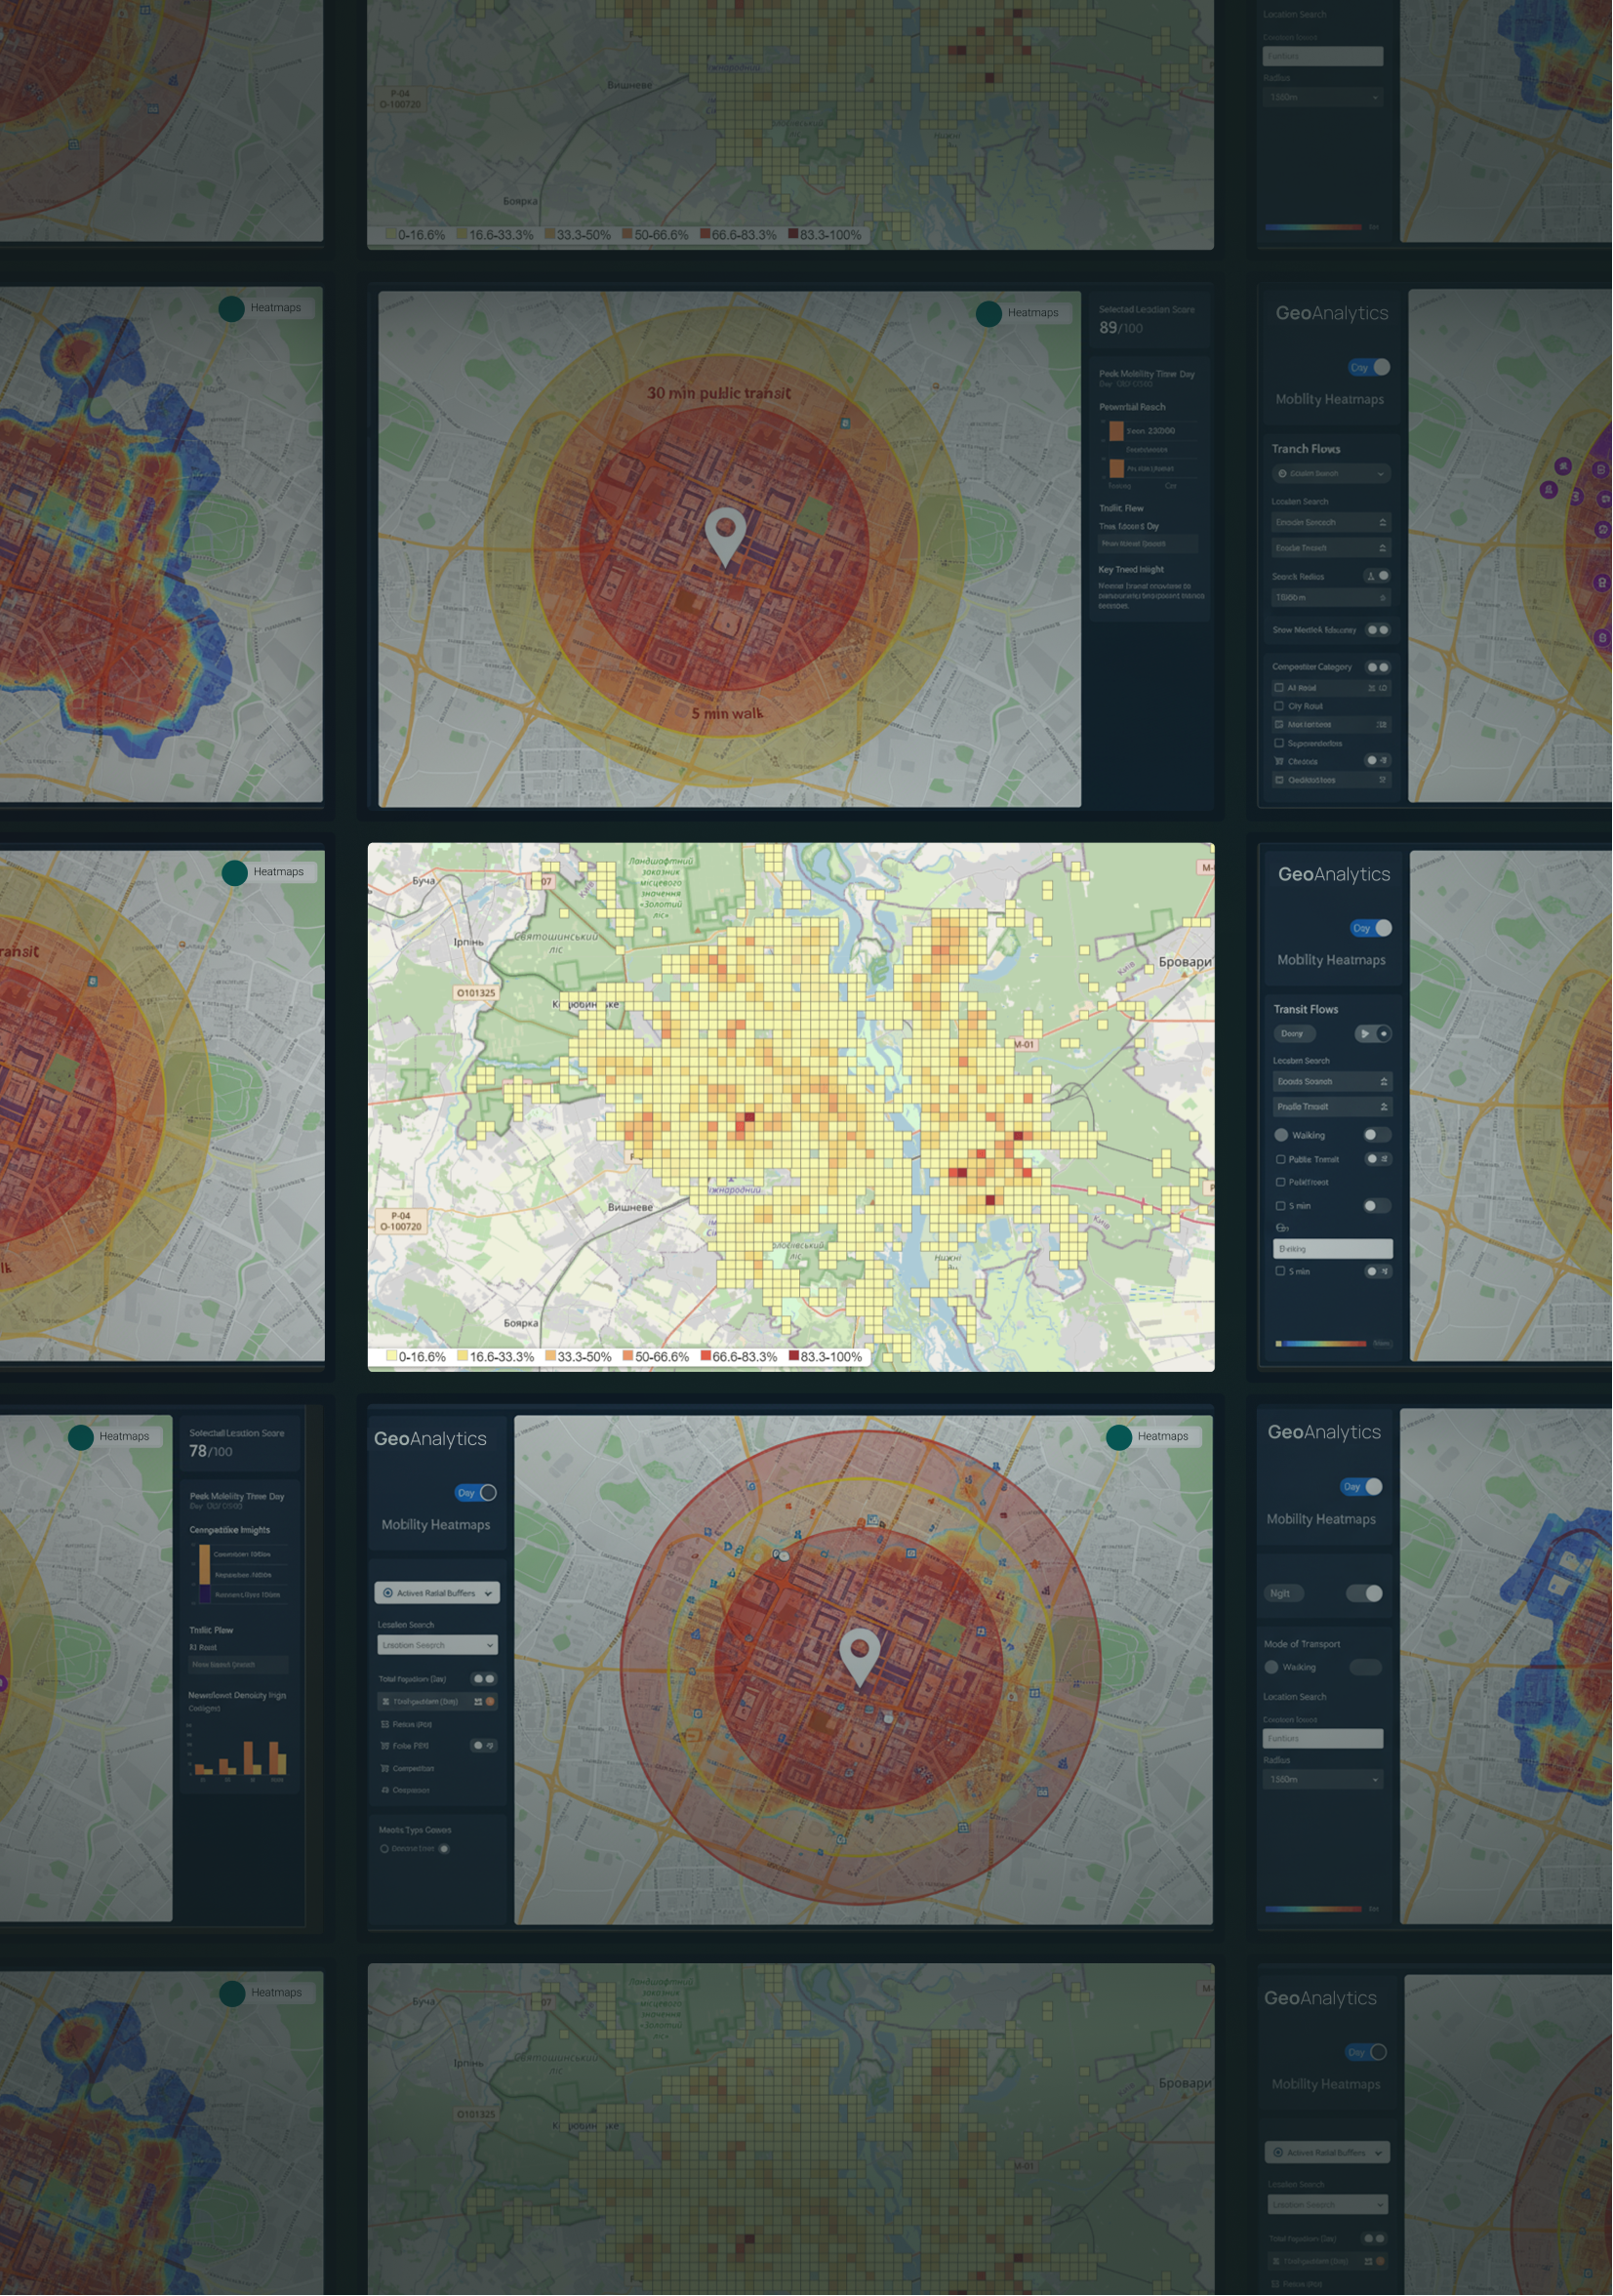
- Geospatial Data Analysis: Aggregation and processing of location-based datasets to evaluate retail site potential.
- Mobility & Heatmap Analytics: Visualization of pedestrian and vehicle flows to identify high-demand areas.
- Strategic Location Intelligence: Data-driven ranking of potential locations based on real behavioral patterns.
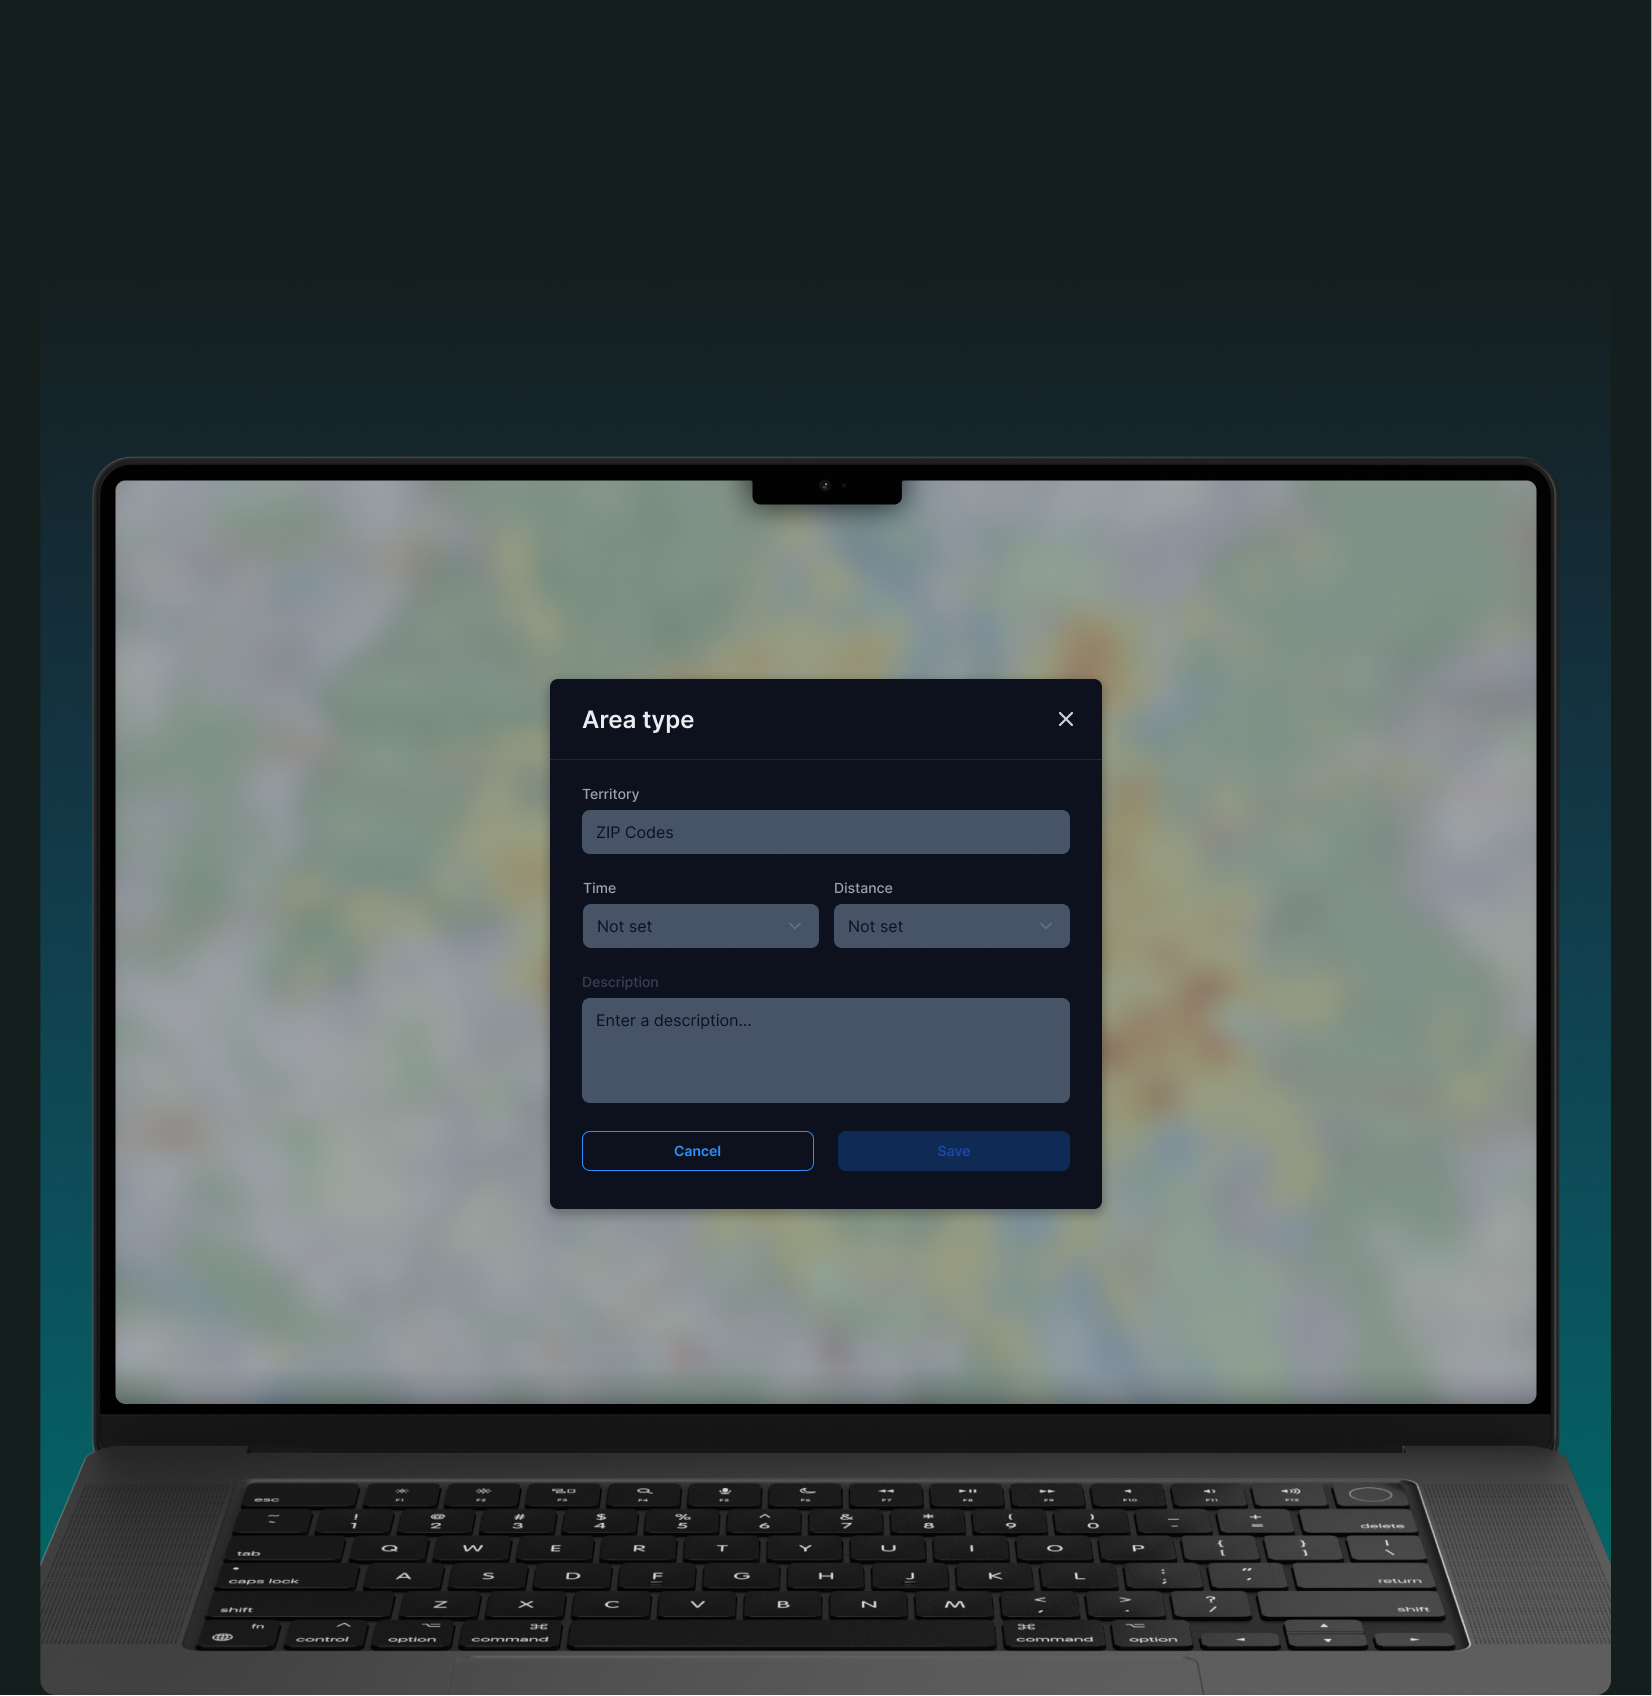
- Interactive Mapping & Dashboarding: Map-based analytics interface for exploring datasets and comparing locations.
- Data Integration & Automation: Centralized ETL pipelines that continuously process and update spatial data
Technology Stack:
- Database: PostgreSQL + PostGIS
- Geospatial Grid: H3 (h3-js for frontend, H3 in DB for backend)
- ETL & Data Processing: Python (Pandas, GeoPandas/Shapely, Dask)
- API Services: FastAPI / Flask
- Frontend & Visualization: React + MapLibre/Mapbox GL + Deck.gl (Heatmap & H3 layers)
- Data Export: CSV/XLSX
- Infrastructure: Docker, AWS/GCP (S3/GCS for raw data, RDS/Cloud SQL for PostgreSQL)
People:
The project was delivered by a multidisciplinary team including a Tech Lead responsible for system architecture and H3/PostGIS solutions, a Data Engineer managing ETL pipelines and GIS analytics, a Backend Engineer developing REST APIs and data export functionality, and a Frontend Engineer building the interactive mapping interface and heatmap visualizations.
The team also included a DevOps/SRE engineer responsible for infrastructure and deployment, a QA Engineer ensuring data accuracy and system reliability, and a Project Manager coordinating client communication, backlog management, demos, and reporting.
Implementation Process
- Data Preparation: Data formats were aligned with mobile network operators (MNOs), NDA requirements, and privacy policies. Initial datasets were prepared and loaded for the pilot city.
- Analytical Engine Development: ETL pipelines were implemented to identify home and work zones and analyze mobility within 5, 30, and 60-minute travel ranges. Spatial metrics were aggregated using the H3 grid.
- API & Visualization: REST APIs were developed alongside a prototype interactive map using React and Deck.gl with multiple analytical layers and adjustable weights.
- Deployment & Integration: Reporting functionality and API documentation were added. The platform was deployed using Docker and cloud infrastructure via AWS ECS.
Result
The GeoAnalytics platform transformed how the client evaluates new store locations. Manual analysis that previously required weeks can now be completed within minutes through automated spatial analytics. Decision-making has shifted from intuition-based site selection to fully data-driven strategies.
Key outcomes include:
- Significant reduction in time required for location analysis
- Lower operational costs by eliminating manual field surveys
- Improved strategic planning through mobility-based insights
- Higher ROI potential by ranking locations based on real customer behavior
- Scalability to expand analysis to new cities and markets
The platform also supports incremental data updates, enabling the retail chain to continuously refine its expansion strategy as new mobility and market data becomes available.
Our Team

Ievgen Lavrishko

Khrystyna Bochko

Alevtyna Kostianchuk

Andriiana Pavlyshyn

Roman Nahaiovskyi

Maria Kizim

Ivanna Soltys
Navigating Our Impressive SOFT Portfolio
-
Development of a Precision Agriculture Site Monitoring Platform


-
Development of an Interactive Street Panorama and GIS Layer Management Platform


-
Development of a Web-Based 3D Point Cloud Visualization Platform


-
Software development for a weather forecast program


-
An AgTech startup needed a way to transform large volumes of agricultural spatial data into actionable insights for farm managers. GIS-Point developed Farm Intelligence AI, an AI-powered geospatial analytics platform that allows users to analyze farm data through natural language queries and visualize results instantly on an interactive map.
-
A European client required an advanced platform to improve fire safety monitoring and emergency response across large buildings and urban environments. GIS-Point developed a Smart Fire Evacuation Digital Twin, an AI-powered 3D platform that integrates sensor networks, surveillance systems, and spatial analytics to provide real-time situational awareness and predictive evacuation planning.


Working on the Project:
A Step-by-Step Journey to Success
PREPARATION
task, provide samples, templates,
instructions.
PILOT PROJECT
for FREE, according to all your
instructions.
AGREEMENT
the cost of further work.
LET’S STARTED!
NDA, after which our team gets to
work.
Have a similar project?
Contact us, we’ll help with its implementation.
United Kingdom
Devonshire str., 41, Ground Floor, London W1G 7AJ, UK
Estonia
Harju maakond, Tallinn, Kesklinna linnaosa, Kaupmehe tn 7-120, 10114, Estonia
Ukraine
Ukraine, Lviv, Sadova street, 2a/1
+380672088520 Ievgen Lavrishko
info@gis-point.com